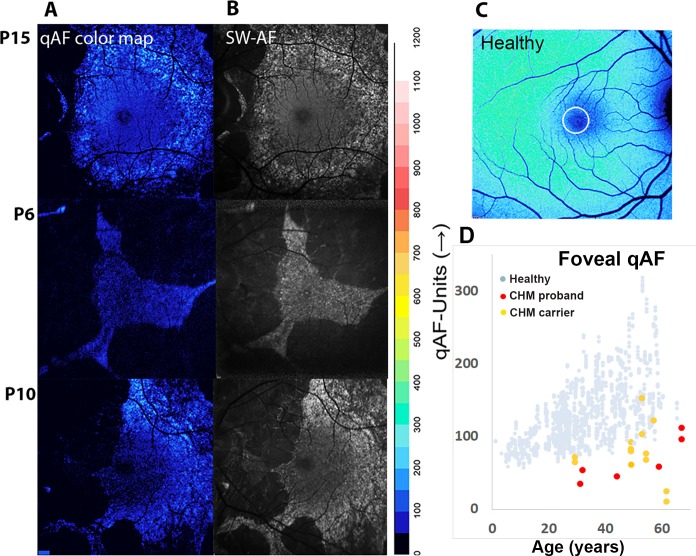
Figure 3.
qAF color-coded images of P15, P6, and P10 (A). Corresponding SW-AF images (B). Healthy age-similar qAF color-coded image (C). qAF values acquired from foveal area (1° eccentricity; circle in C) and plotted as a function of age for healthy subjects (blue circles), CHM probands (P1, P5, P7, P9, P10, and P15; red circles), and CHM carriers (carriers 1, 3, 4, 7, 8, and 9; yellow circles) (D).

