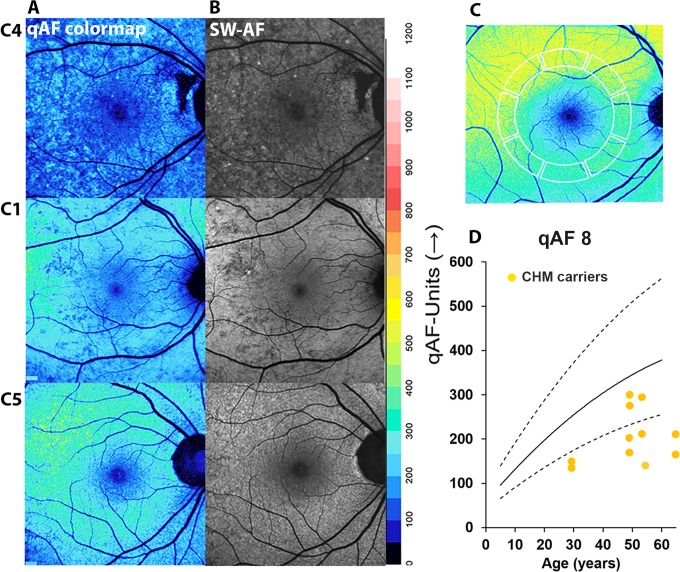
Figure 4.
qAF in CHM carriers. qAF color-coded images of CHM carrier 4, carrier 1, and carrier 5 (A). Corresponding SW-AF images (B). Healthy (age 55 years) qAF color-coded image (C). qAF8 values (yellow circles) acquired from 8 concentric segments (7°–9° eccentricity; outlined in C) and plotted as a function of age for carriers 1, 4, 5, 7, 8, and 9 (D). Mean (solid black line) ± 95% CIs (dashed lines).

