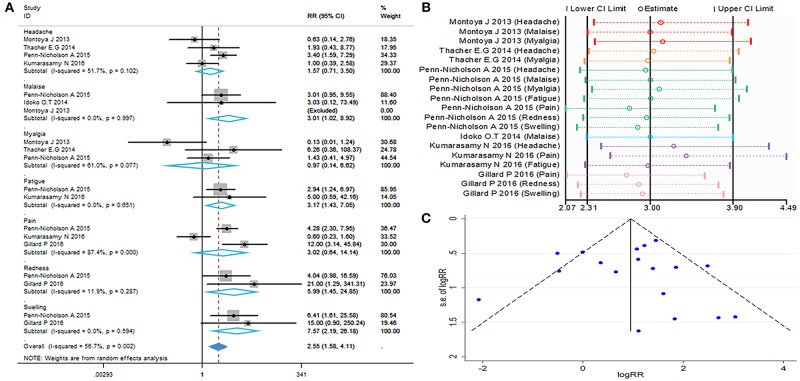
Figure 6.
Safety evaluation. (A) Forest plot: a RR >1 indicates that the vaccine was protective, the result of intersection with the intermediate invalid line was invalid. RR = 1, invalid result. Point estimates and 95%CI are shown for each study and for the pooled results. (B) Influence analysis, examine the impact of a study on the total combined effect. The vertical solid line in the middle indicates the total combined effect, while the left and right vertical solid lines indicate 95%CI. (C) Funnel plot: the publication bias was independently assessed by determining the symmetrical distribution of the studies.

