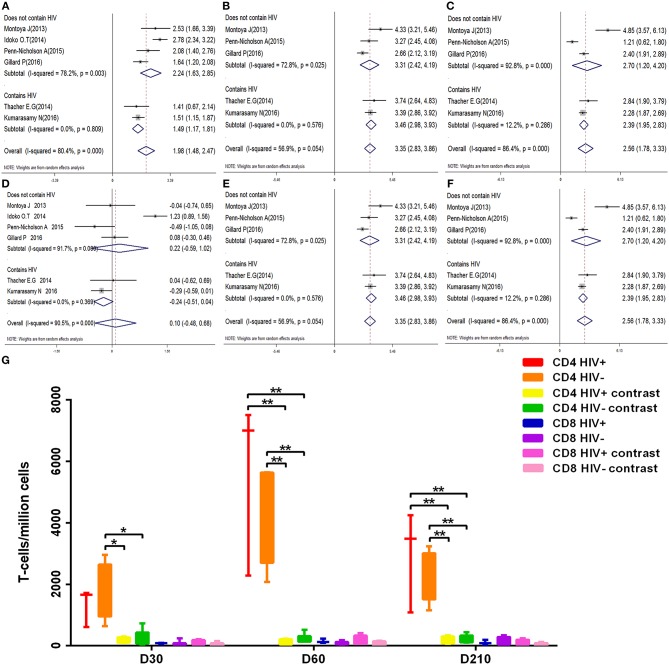
Figure 7.
Subgroup analysis polyfunctional CD4+ and CD8+ T-cell. (A–F) Forest plot: a SMD > 0 indicates that vaccine can effectively stimulate the growth of polyfunctional CD4+ or CD8+ T-cells. SMD = 0, invalid result. (A–C) are the result of polyfunctional CD4+ T-cell analysis of D30, D60, and D210, respectively. (D–F) are the result of polyfunctional CD4+ T-cell analysis of D30, D60, and D210, respectively. (G) Box diagram: The transverse coordinates are the date of vaccination. The longitudinal coordinates are the number of polyfunctional CD4+ or CD8+ T-cells. Statistically significant differences between the two groups are indicated by star symbols: *p < 0.05; **p < 0.001.

