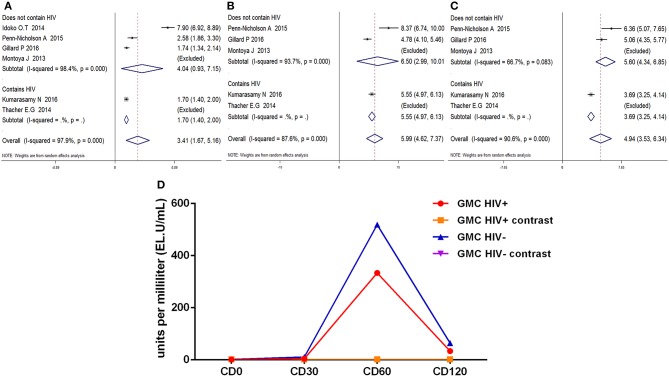
Figure 8.
Subgroup analysis Anti-M72 antibody IgG geometric mean concentration(GMC). (A–C) Forest plot: SMD >0 indicates that the vaccine was protective. SMD = 0, invalid result. Point estimates and 95%CI are shown for each study and for the pooled results. (D) Line chart: the anti-M72 IgG GMC varies (Ordinate) with time in different time points (Abscissa) after vaccination.

