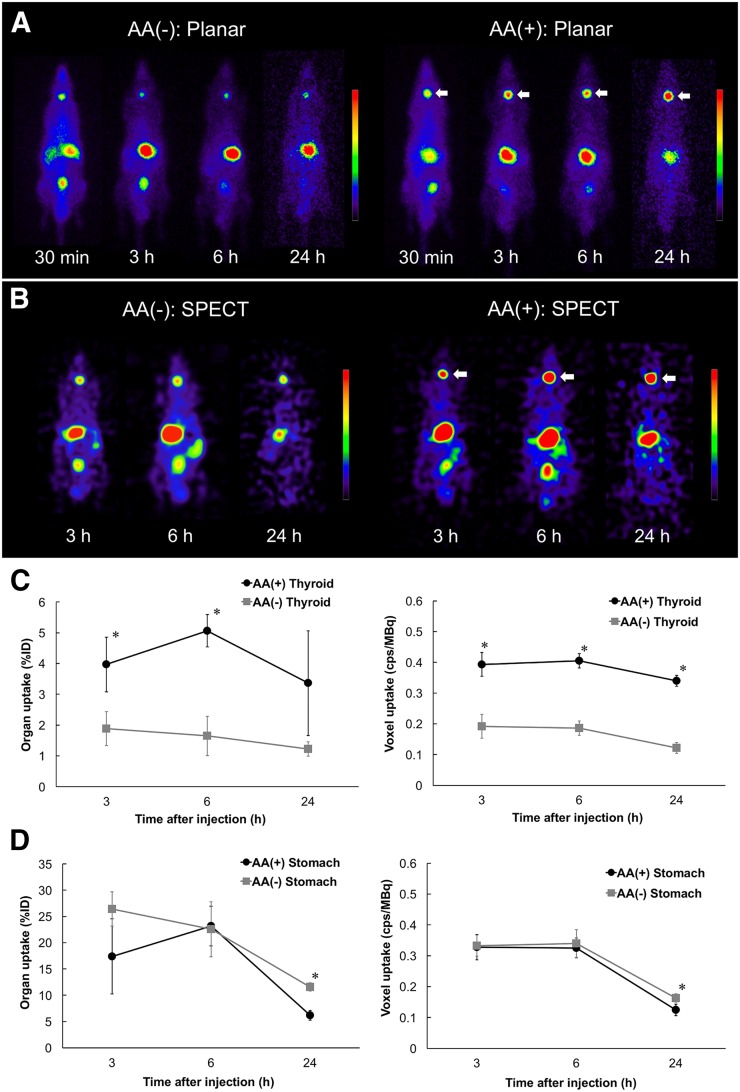
FIGURE 2.
(A and B) Planar (A) and SPECT (B) images of normal rats: AA(−) group and AA(+) group. Increased uptake was observed in thyroid gland (arrows) under AA(+) condition as compared with AA(−) condition. (C and D) Time–activity curves in thyroid (C) and stomach (D) after injection of 211At solution on planar and SPECT (cps/MBq) images. %ID = percentage injected dose. *P < 0.05.

