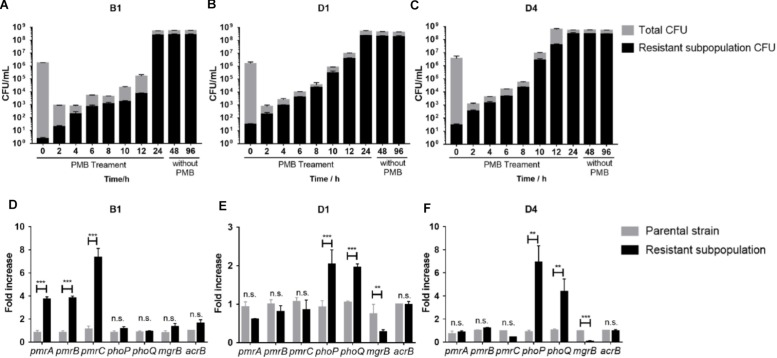
FIGURE 3.
(A–C) Polymyxin B -resistant subpopulation CFU and total CFU of B1, D1, and D4 during 24 h treatment with 16 mg/L polymyxin B in liquid culture and subculture without polymyxin B for further 24 and 72 h (n = 3). (D–F) qRT-PCR analysis of the phoP, phoQ, mgrB, pmrA, pmrB, pmrC, and acrB gene expression in resistant and susceptible subpopulations of B1, D1, and D4. Relative abundance was calculated by normalizing the expression of each gene to the average expression of the housekeeping gene, rpoB (n = 4). Statistically significant: ∗P < 0.05, ∗∗P < 0.01, and ∗∗∗P < 0.001. n.s., not significantly different (unpaired t-test).

