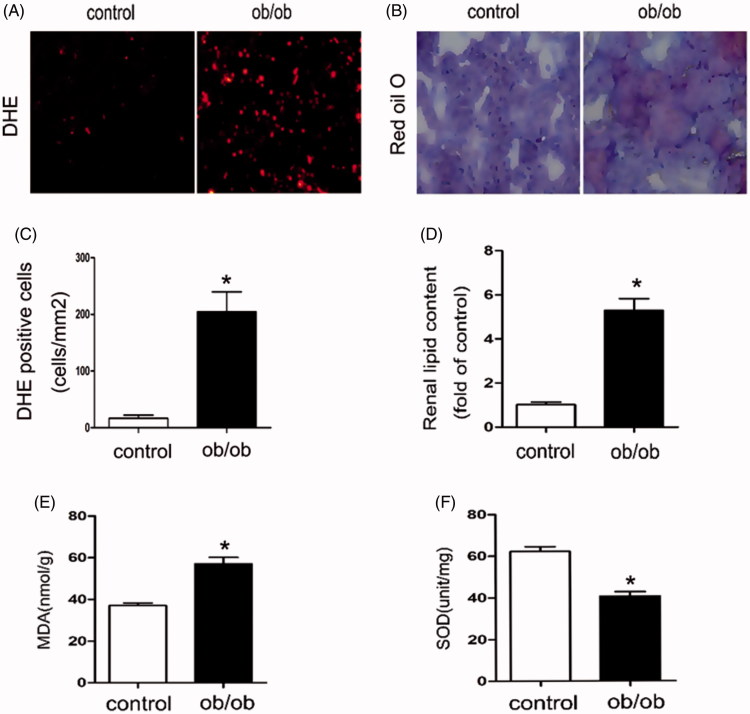
Figure 3.
The oxidative stress and renal total lipid were increased in ob/ob mice. Kidney samples were collected from ob/ob mice or C57BLK mice (control). Thebaseline characteristics of these mice were shown in Table 2. (A) DHE staining of kidney tissue, 200×; (B) Oil Red O-stained kidney sections, 400×. (C) Statistics analysis of DHE positive cells. Values are the mean ± SE, *p < 0.05, compared with control; (D) Quantitative measurement of FFA and TG contents in the kidneys. Values are the mean ± SE, *p < 0.05, compared with control; (E) Determination of MDA levels in Serum by ELISA Kit, Values are the mean ± SE, *p < 0.05, compared with control; (F) Determination of SOD levels in Serum by ELISA Kit, Values are the mean ± SE, *p < 0.05, compared with control.

