Figure 2.
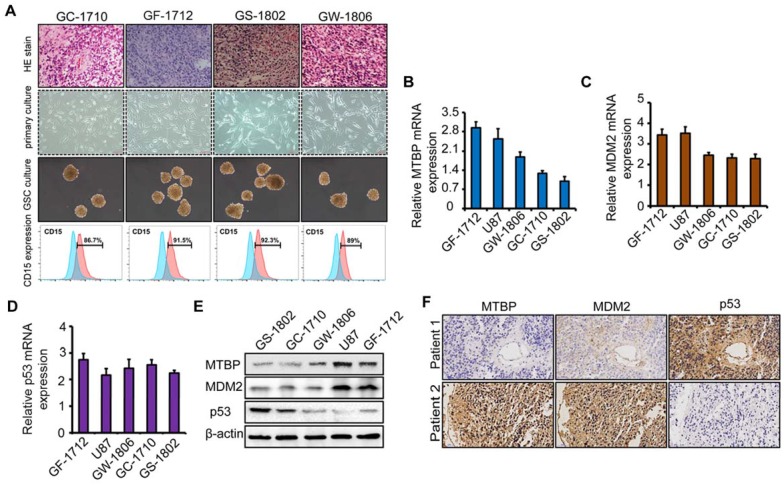
The association of MTBP, MDM2, and p53 expressions in TP53wt GBMs. A: HE stained images of the original patient tumors, patient-derived primary glioma and neurosphere cultures, and the expression of CD15 in GSCs of TP53wt GC-1710, GF-1712, GS-1802, and GW-1806. B-D: Real-time PCR analyses of the mRNA expressions of MTBP (B), MDM2 (C), and p53 (D). E: Western blotting analyses of MTBP, MDM2, and p53 protein levels. F: Staining of consecutive sections of clinical TP53wt GBM specimens for MTBP, MDM2, and p53 distribution assessment by IHC.

