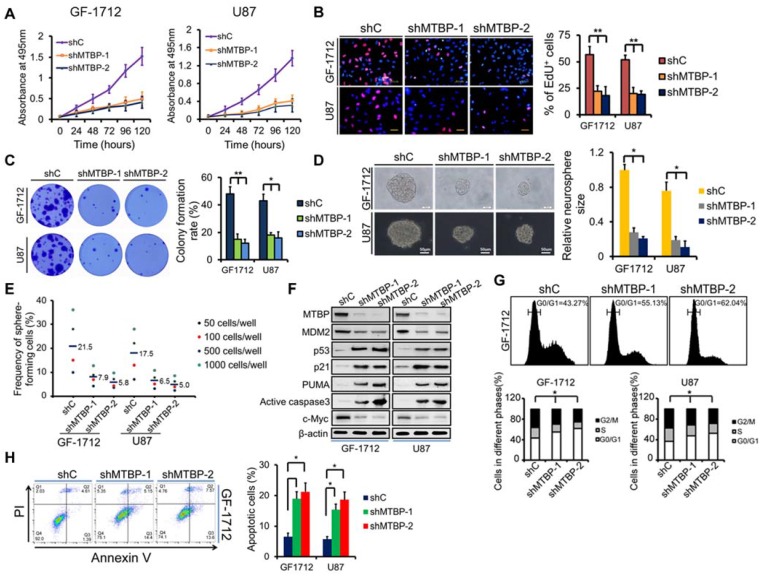
Figure 3.
Effect of MTBP silencing on in vitro TP53wt GBM cell growth. A: Effect of MTBP knockdown by shRNA on cell viability in TP53wt GF-1712 and U87 cells. B: Representative images of EdU staining cell proliferation assay (left) and quantification of EdU-positive cells (right). Nuclei were counterstained with Hoechst 33342. Scale bar: 50 μm. C: Effect of MTBP silencing on TP53wt GBM cell colony formation. D: Representative images of GF-1712 and U87 neurospheres transduced with shRNA targeting MTBP, with ShC serving as a control (left). Quantification of relative neurosphere sizes of indicated GSCs (right). Scale bar: 20 μm (upper) and 50 μm (lower). E: Effect of MTBP silencing on the in vitro clonogenicity of GF-1712 and U87 GSCs. F: Western blotting analysis of MTBP, MDM2, p53, p21, PUMA, active caspase3 and c-myc protein levels in GF-1712 and U87 cells transfected with shRNAs targeting MTBP or a control shRNA. G: Effect of MTBP knockdown on G0/G1 in TP53wt GBM cells as determined by flow cytometry. H: Effect of MTBP silencing on the apoptosis of GF-1712 and U87 cells as demonstrated by Annexin V/PI staining and flow cytometry analyses. Results are presented as mean ± SEM of triplicate samples from three independent experiments. *P<0.05, **P < 0.01.

