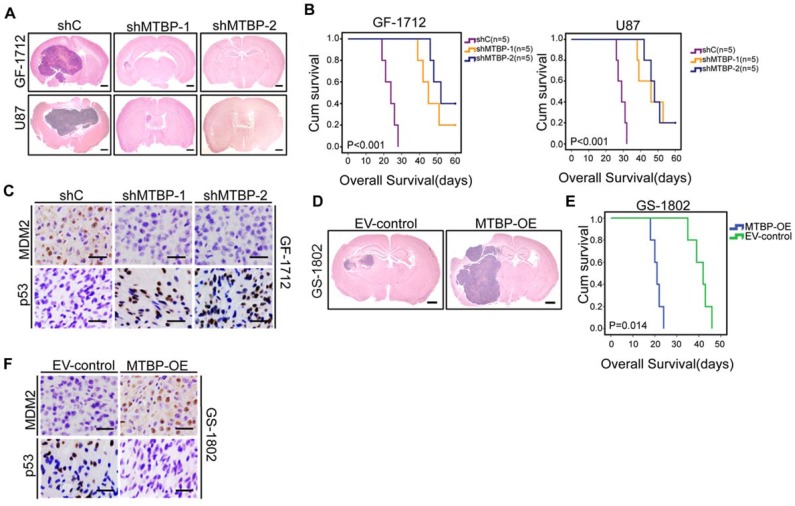
Figure 5.
Effect of MTBP on in vivo TP53wt GSCs growth. A: Representative HE stained images of mice brain sections after intracranial transplantation of TP53wt GSCs transfected with shC, shMTBP-1, or shMTBP-2. Brains were harvested at 15 days after transplantation. Scale bar: 1 mm. B: Kaplan-Meier survival curves of mice injected with TP53wt GSCs transfected with shC, shMTBP-1, or shMTBP-2. C: Representative IHC images of MDM2 and p53 proteins in intracranial tumors derived from GF-1712 GSCs transfected with shC, shMTBP-1, or shMTBP-2. Scale bar: 25 μm. D: Representative HE stained images of mice brain sections after intracranial transplantation of GS-1802 GSCs transduced with MTBP-overexpression plasmids or empty vector. Brains were harvested at 15 days after transplantation. Scale bar: 1 mm. E: Kaplan-Meier survival curves of mice injected with GS-1802 GSCs transduced with MTBP-overexpression plasmids or empty vector. F: Representative IHC images of MDM2 and p53 proteins in intracranial tumors derived from GS-1802 GSCs transduced with MTBP-overexpression plasmids or empty vector. Scale bar: 25 μm.

