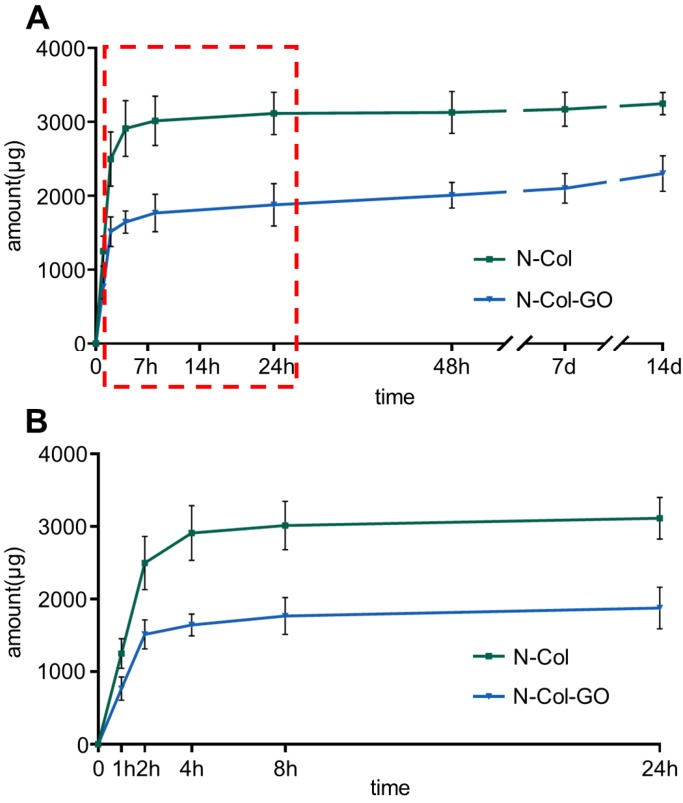
Figure 3.
NAC release curve of N-Col-GO hybrid membrane after 14 d (A) and 24 h (B). The green curve indicates that most of the NAC, up to 3114.937±287.675 μg, was released within 24 h in N-Col membrane. The blue curve shows that the N-Col-GO hybrid membrane released 1877.837±287.617 μg of NAC within 24 h followed by sustained release up to 2302.462±239.754 till 14 d indicating that N-Col-GO had a better drug release ability.

