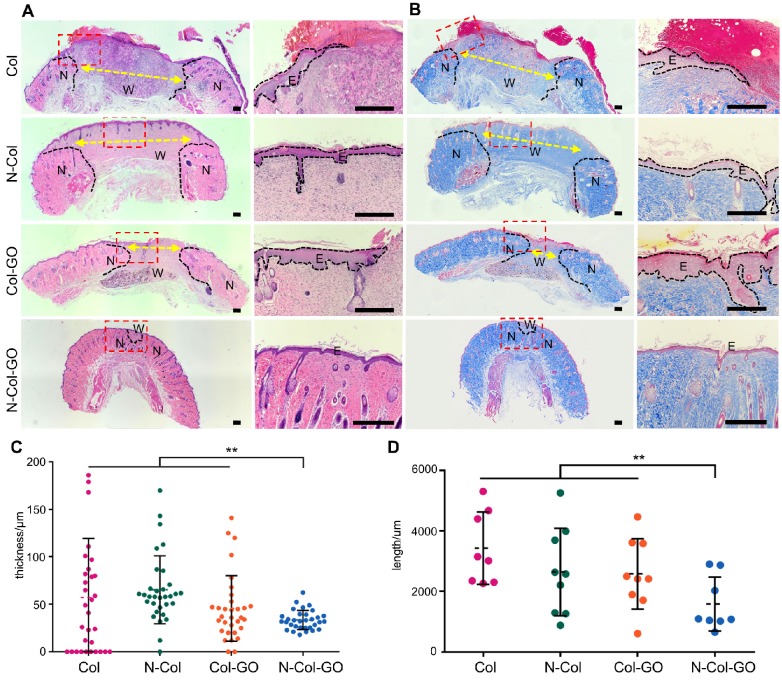
Figure 7.
Histological analysis of wound areas on day 14. (A&B) H&E staining and Masson staining of tissue sections. The dotted line is the interface between the wound area and neo-epidermis. Yellow arrows indicate remaining wound length; W, wound area; N, neo-epidermis; E, epidermis. Scale bar = 200 μm. (C) Thickness of regenerated epidermis. (D) Length of the remaining wound. Data represent means ± SD (n = 8) (*:P < 0.05, **:P< 0.01)

