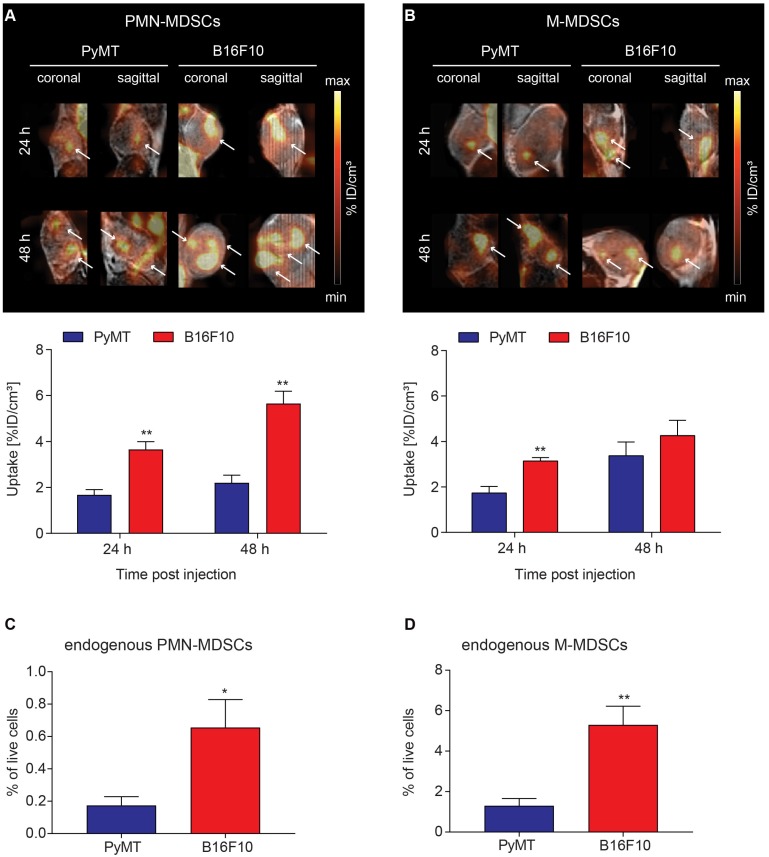
Figure 4.
Visualization of [64Cu]PMN-MDSC and [64Cu]M-MDSC homing to primary tumors and correlation with endogenous MDSCs. Representative coronal and sagittal PET/MR images of (A) [64Cu]PMN-MDSCs and (B) [64Cu]M-MDSCs in primary PyMT breast tumors (left panel) and primary B16F10 melanoma (right panel). White arrows highlight hot spots of [64Cu]PMN- and [64Cu]M-MDSC uptake in the tumors revealing non-homogeneous cell distribution. Quantification of [64Cu]PMN-MDSC (A, lower panel) and [64Cu]M-MDSC (B, lower panel) migration 24 h and 48 h post injection (mean ± SEM in %ID/cm³, [64Cu]PMN-MDSC: n=5 for PyMT, n=6 for B16F10 and [64Cu]M-MDSC: n=6 for PyMT, n=5 for B16F10, statistics: Student's t-test, **p<0.01) revealed increased [64Cu]PMN- and [64Cu]M-MDSC homing to B16F10 melanomas in comparison to PyMT tumors. Correlation of uptake values of adoptively transferred [64Cu]PMN- and [64Cu]M-MDSCs to the endogenous PMN- (C) and M-MDSCs (D) in the PyMT and B16F10 tumors revealed a similar pattern of MDSCs in the tumors with higher cell frequencies of PMN- and M-MDSCs in the primary B16F10 tumors than the PyMT tumors (n=4, statistics: two-tailed Student's t-test, *p<0.05, **p<0.01).

