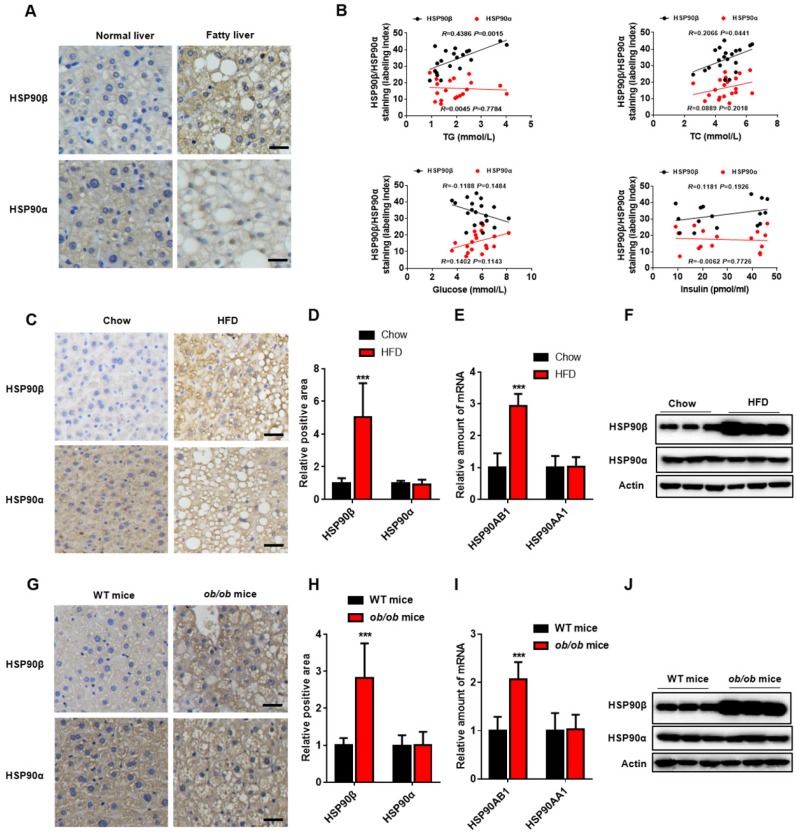
Figure 1.
The Level of HSP90 paralogs in the Liver of Obese Mice and NAFLD Patients. (A) The immunohistochemistry staining of HSP90β or HSP90α in the liver of healthy donors (n=5) and NAFLD patients (n=20). (B) The correlation between immunostaining signal of HSP90s and the clinical parameters including serum level of glucose, insulin, TG and TC (n=20). (C, D, G, H) Liver sections of HFD-induced obese mice (C, D) or ob/ob mice (G, H) were stained with HSP90 paralog specific antibodies. (D and H) The mRNA level of HSP90AB1 or HSP90AA1 in the liver was analyzed in HFD- induced obese mice (E) and ob/ob mice (I), respectively. n = 9 for chow group or HFD group; n = 14 for WT mice group, n = 8 for ob/ob mice group. (F and J) The protein level of HSP90α or HSP90β in the liver was analyzed by western blot in HFD- induced obese mice (E) and ob/ob mice (I), respectively. Error bars are represented as mean ± SEM. The Pearson correlation coefficient is used to test the correlation between HSP90 paralogs expression and clinical parameters (B). Student t-test was used to analyze significance between two sets of data (D and F). ***p < 0.001 vs chow diet mice or WT mice.

