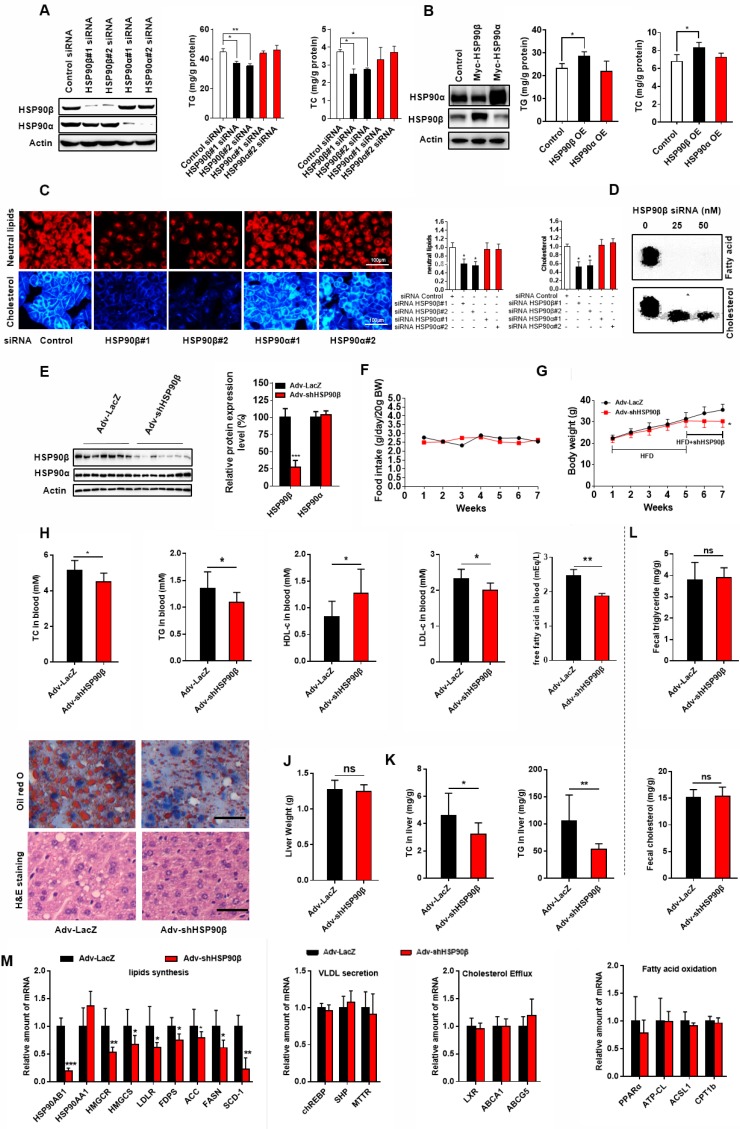
Figure 2.
Knockdown of HSP90β Improves Lipid Homeostasis. (A and B) The cellular TG and TC levels were measured in human liver HL-7702 hepatocytes transfected with siRNA targeting HSP90β or HSP90α (A) or overexpression (OE) of HSP90β (3.6 times) or HSP90α (4.2 times) (B), the effect of interference or overexpression was verified by western blot. (C) The siRNA treated HL-7702 hepatocytes incubated in medium B for 48 h, and then switched to medium D for another 24 h. The cells then were stained with Nile-Red, which specifically recognizes neutral lipids or filipin, which definitely binds free cholesterol. (D) HL-7702 hepatocytes were incubated in medium B treating with indicated concentrations of siRNA HSP90β for 48 h, and then switched to medium D for another 24 h. Acetic acid sodium salt 1-14C was directly added into the medium and incubated for additional 2 h. The radioactive products were identified by comparison with unlabeled standards and visualized with iodine vapor. (E-L) Male C57BL/6J mice (6 weeks) were randomly grouped (10 mice each group). Mice were allowed ad libitum access to water and high fat diet (HFD). After four weeks, mice were intravenously injected with titer of 5×10⁹ adenovirus expressing the shRNA targeting HSP90β or the shRNA targeting LacZ. HFD was still administrated to mice for additional 14 days. Then, mice were sacrificed and subjected to various analysis. (E) The total protein from mice liver were prepared, and subjected to immunoblot analysis. Statistical analysis of hepatic HSP90β protein level in panel E normalized to Actin. (F) Food intake during the six week treatment. (G) Body weight measurement during the six weeks treatment. (H) The effect of HSP90β knockdown on serum TG, TC, HDL-c and LDL-c levels. (I) Oil red staining of liver sections. (J) The weight of liver. (K) The TC and TG level in the liver. (L) The TC and TG in the feces were analyzed by GC-MS. (M) Lipid mebabolism related genes expression was detected by q-RT-PCR. Mouse GAPDH was used as the internal control. Error bars are represented as mean ± SEM. Statistical analysis was done with one-way ANOVA (Dunnett's post test) (A, B and C), two-way ANOVA (Bonferroni's test) (F and G), or student's t-test (E, H, J, K, and L). *p < 0.05, **p < 0.01, ***p < 0.001 vs control vector, control adenovirus or control siRNA.

