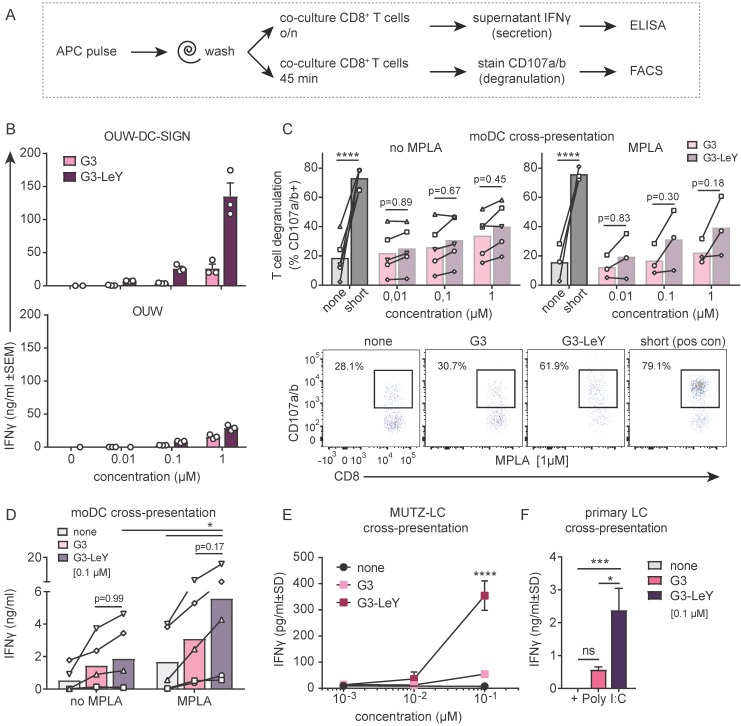
Figure 4.
Enhanced cross-presentation of glyco-dendrimers by moDC and primary LC. A. APC were pulsed with the (glyco)-dendrimers for 3 hours or 30 minutes, washed and co-cultured with a gp100 specific T cell clone for either 45minutes or o/n. CD8+ T cell activation was measured by FACS using CD107a/b staining for degranulation or by ELISA for IFNγ secretion in the supernatant B. IFNγ production of gp100 specific T cells after o/n culture with pulsed OUW cells transduced with DC-SIGN (upper panel) or Langerin (lower panel).Representative of n=2±SD measured in triplicate C. Degranulation of gp100 specific T cells following 45min culture with 3 hour pulsed moDC in the absence (left) or presence (right) of the TLR4 stimulus MPLA. n=3-5, each symbol represents a donor. Representative dot plots for MPLA 1µM D. IFNγ production by gp100 specific T cells following o/n culture with 30 minutes pulsed moDC in the absence or presence of the TLR4 stimulus MPLA. n=5, each symbol represents a donor. E-F. IFNγ production by gp100 specific T cells following o/n co-culture with 3 hour pulsed (E) MUTZ-LC or (F) primary LC in the presence of TLR3 stimulus Poly I:C. Representative of n=2±SD measured in triplicate. (Statistical analysis: C,D two-way ANOVA Sidak's post hoc, D,E one-way ANOVA Tukey's post hoc)

