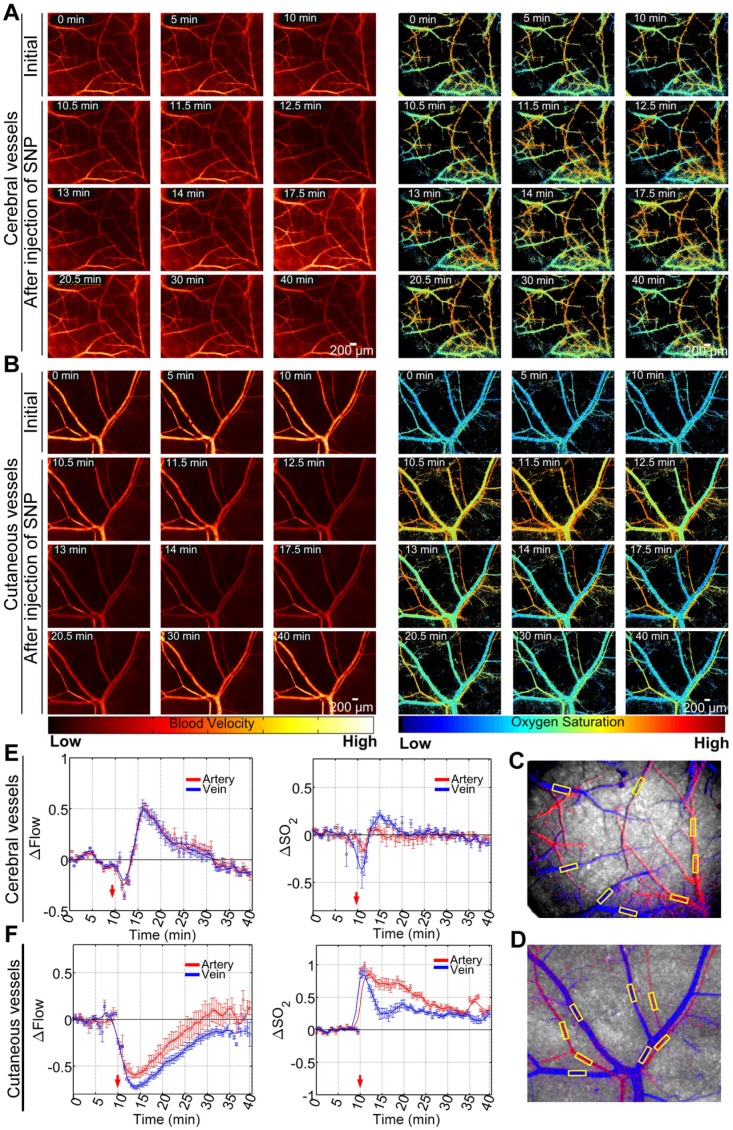
Figure 2.
Maps of dynamic responses of blood flow and blood oxygen saturation in non-T1D mice (1 week). (A) Typical blood flow and blood oxygen saturation maps of cerebral vessels viewed through an optical clearing skull window before and after the injection of SNP. (B) Typical blood flow and oxygen saturation maps of cutaneous vessels viewed through an optical clearing skull window before and after the injection of SNP. Arteriovenous segmentation maps of cerebral (C) and cutaneous (D) microvessels (red: artery; blue: vein; yellow rectangular boxes were used for statistical analysis). Statistical analyses based on the yellow rectangular boxes containing vessel positions were performed to show the time courses of relative changes in blood flow and blood oxygen saturation in cerebral (E) and cutaneous (F) microvessels (mean ± standard error).

