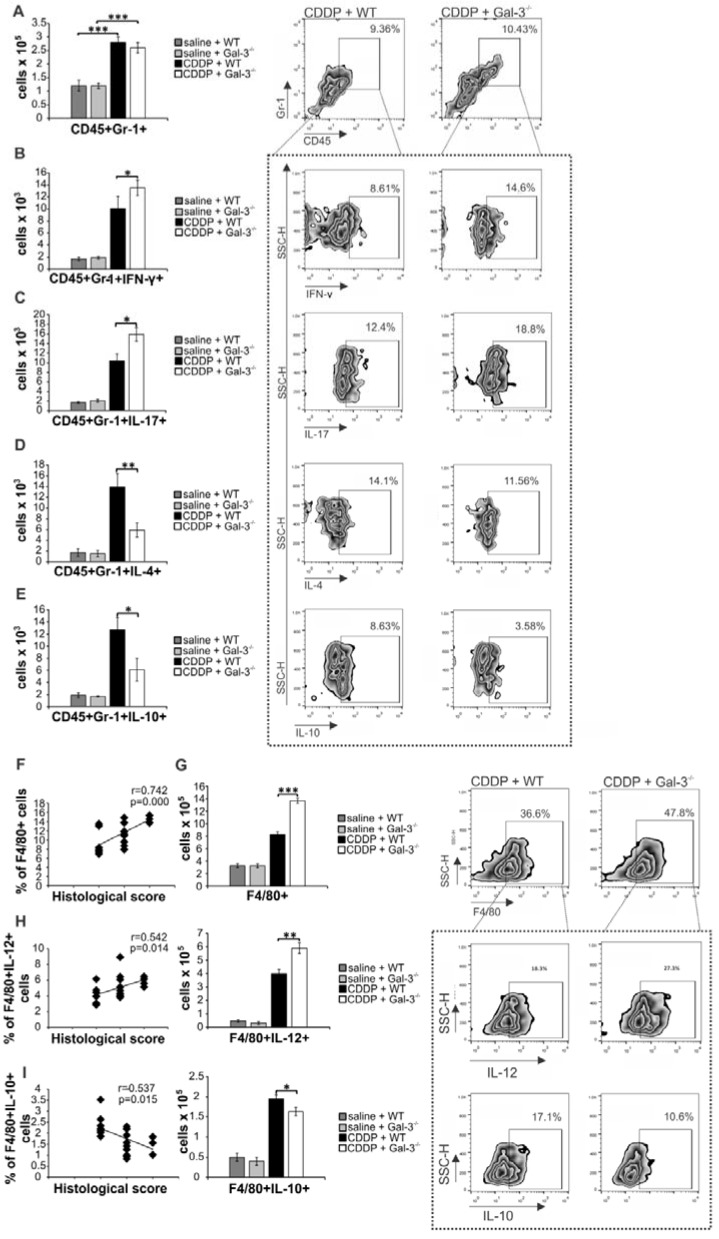
Figure 3.
Gal-3 deficiency promoted development of inflammatory phenotype in renal-infiltrated neutrophils and macrophages. Bar graphs (left panels) and representative density plots obtained by flow cytometry analysis and intracellular staining of renal-infiltrated neutrophils and macrophages derived from saline or CDDP-treated WT and Gal-3-/- mice, 72 h after CDDP administration (16 mg/kg body weight). There was no significant difference in total number of CD45+Gr-1+neutrophils (gated as CD45+Gr-1+cells in population of renal infiltrated cells) between CDDP-injured kidneys of WT and Gal-3-/- animals (A). Significantly higher number of inflammatory, IFN-γ (B) and IL-17-producing neutrophils (C), and notably lower total number of IL-4-producing (D) and IL-10 producing neutrophils (E) were noticed in the kidneys of CDDP-treated Gal-3-/- mice. Representative density plots show percentages of IFN-y-, IL-17-, IL-4- and IL-10-producing neutrophils (Fig.2B-E), gated in the population of CD45+Gr-1+ renal infiltrated cells. Strong positive correlation was observed between histological score and total number of renal-infiltrated macrophages (F) which was found in significantly higher number in the kidneys of CDDP-treated Gal-3-/- mice (G). Representative density plots showing higher percentage of macrophages in renal infiltrated cells of CDDP-treated Gal-3-/- mice compared to similarly treated WT animals (G, right panel). Macrophages are determined as F4/80+cells, gated in population of CD45+CD11c- renal infiltrated cells. Significantly higher number of IL-12-producing M1 macrophages (H, left panel), but lower number of IL-10-producing M2 macrophages (I, right panel) were noticed in the kidneys of CDDP-treated Gal-3-/- mice. Positive correlation was observed between histological score and total number of IL-12-producing renal-infiltrated M1 macrophages (H, middle panel) and negative correlation was noticed between histological score and total number of IL-10-producing renal-infiltrated M2 macrophages (I, middle panel). Representative density plots show percentages of IL-12-producing (H, right panel) and IL-10-producing macrophages (I, right panel), gated in the population of F4/80+ renal infiltrated cells of CDDP-treated WT and Gal-3-/- animals. Data from two individual experiments with 8 mice per group are shown as Mean ± SEM; *p<0.05, **p<0.01,***p<0.001.

