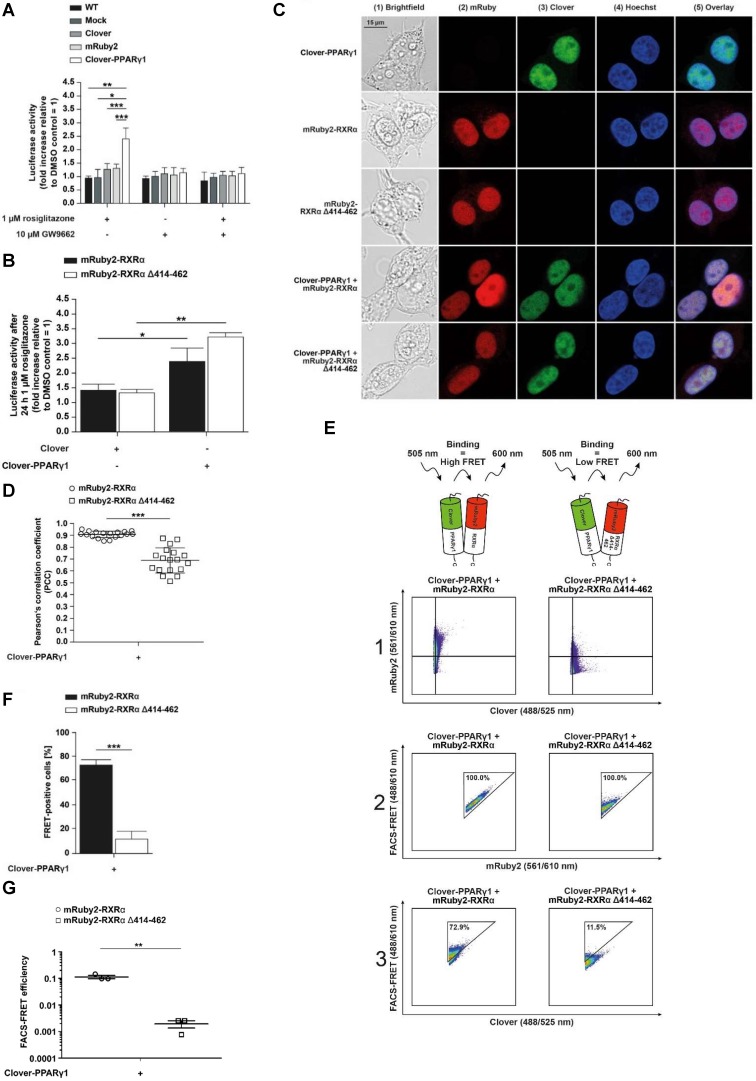
Figure 3.
Analysis of protein-protein interactions between Clover-PPARγ1, mRuby2-RXRα and mRuby2-RXRα Δ414-462. A PPARγ‑dependent transactivation assay was used in HEK293T cells to verify the mechanistic functionality of the Clover, Clover-PPARγ1, mRuby2, mRuby2-RXRα and mRuby2-RXRα Δ414-462 (A and B). HEK293T cells expressing protein(s) as indicated were stimulated for 24 h with 1 µM rosiglitazone and 10 µM GW9662 alone or in combination. Values from PPARγ‑dependent transactivation experiments are means ± SD of three to ten individual experiments. Each PPARγ‑dependent transactivation assay experiment was performed in quadruple. *P ≤ 0.05, **P ≤ 0.01 and ***P ≤ 0.001. Fluorescence microscopy images of HEK293T cells expressing Clover-PPARγ1, mRuby2-RXRα, mRuby2-RXRα Δ414-462, Clover-PPARγ1 + mRuby2-RXRα and Clover-PPARγ1 + mRuby2-RXRα Δ414-462 are depicted (C). The brightfield is shown in panel 1 (1). The mRuby2-positive cells are depicted in panel 2 (2), Clover in panel 3 (3), Hoechst 33342-stained cell nuclei in panel 4 (4) and an overlay to estimate the localization is provided in panel 5 (5). Images are representative for experiments which were performed at least three times. The PCC was used for the correlation quantification of the subcellular co-localization of Clover-PPARγ1 expressed in combination with mRuby2-RXRα or mRuby2-RXRα Δ414-462 (D). R-Values are means ± SD of at least 18 individual cells. ***P ≤ 0.001. Representative primary flow cytometry-plots from an experiment which was performed three times showing the amount of FRET-positive living HEK293T cells expressing Clover-PPARγ1 + mRuby2-RXRα and Clover-PPARγ1 + mRuby2-RXRα Δ414-462 (E). The numbers in panel 3 (3) give total percentages of HEK293T cells within the FRET gate. A comparison of the total percentages of FRET-positive living HEK293T Clover-PPARγ1 + mRuby2-RXRα and HEK293T Clover-PPARγ1 + mRuby2-RXRα Δ414-462 cells is depicted in (F). Flow cytometry-based FRET efficiencies, depicted in (G), are calculated as described in Materials and Methods. Values are means ± SD of three experiments. **P ≤ 0.01, ***P ≤ 0.001.

