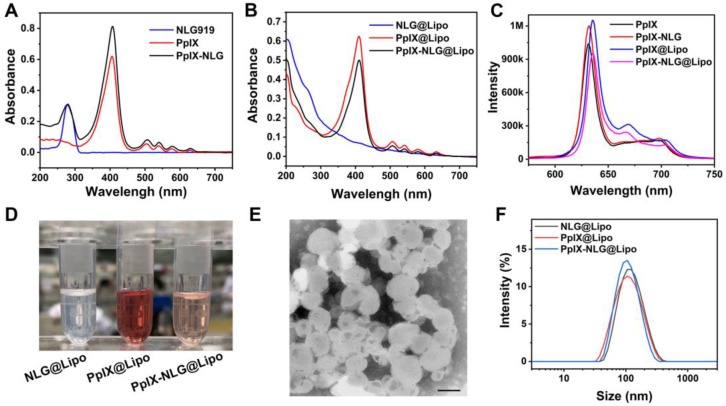
Figure 1.
(A) UV-vis spectrum of NLG919, PpIX, and PpIX-NLG in DMSO. (B) UV-vis spectrum of NLG@Lipo, PpIX@Lipo, and PpIX-NLG@Lipo in aqueous solution. (C) Fluorescence emission spectrum of PpIX and PpIX-NLG in DMSO, PpIX@Lipo and PpIX-NLG@Lipo in aqueous solution, respectively. (D) Representative photographs of NLG@Lipo, PpIX@Lipo, and PpIX-NLG@Lipo. (E) Representative TEM image of PpIX-NLG@Lipo (scale bar =100 nm). (F) Size distribution of NLG@Lipo, PpIX@Lipo, and PpIX-NLG@Lipo in aqueous solution determined by DLS.

