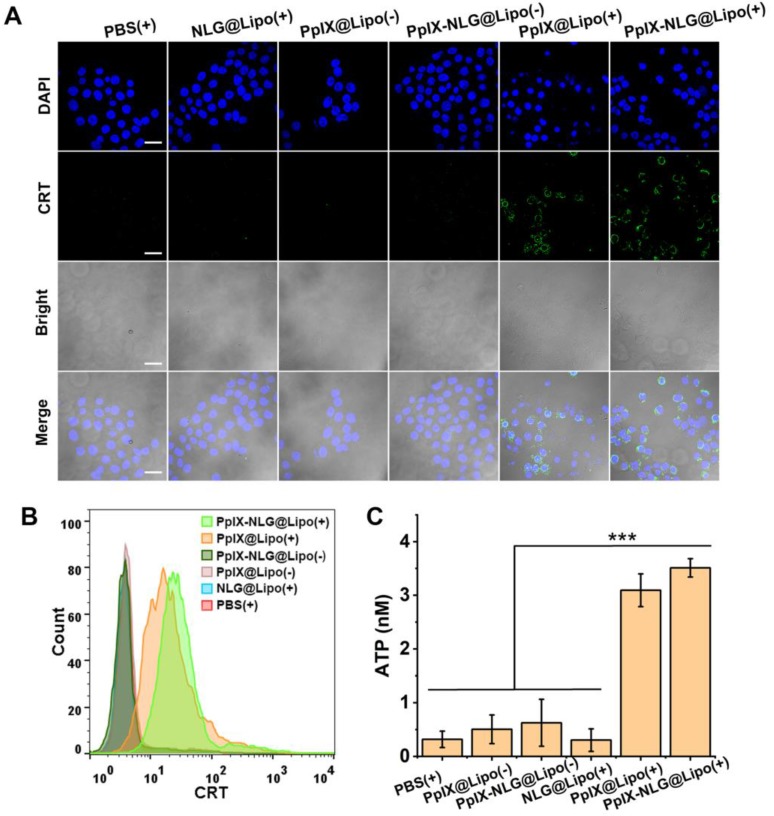
Figure 4.
CRT expression of 4T1 cells with LED light irradiation (630 nm, 20 mW/cm2, 10 min) after incubation with PBS, NLG@Lipo, PpIX@Lipo or PpIX-NLG@Lipo, observed by CLSM (A) and quantified by FCM (B). (Scale bar = 20 μm). (C) Extracellular ATP release of 4T1 cells with LED light irradiation (630 nm, 20 mW/cm2, 10 min) after incubation with PBS, NLG@Lipo, PpIX@Lipo or PpIX-NLG@Lipo. (+) and (-) respectively refer to with or without irradiation.

