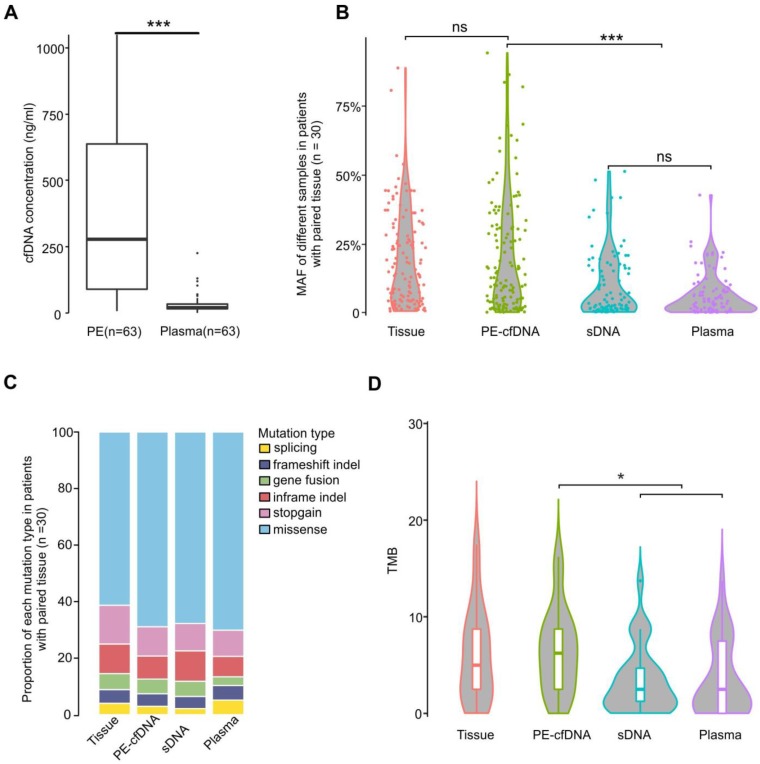
Figure 1.
Characteristics of different sample types. A) cfDNA concentrations in PE-cfDNA and plasma from all 63 patients. The Mann-Whitney test was used to test the differences between PE-cfDNA and plasma. B) The MAFs of all detected mutations in different samples from cohort 1 patients (n = 30). Each dot represents one patient. C) The proportions of different mutations in each sample type in cohort 1 patients (n = 30). D) TMB distributions in each sample type. For B) and D), the One-way ANOVA on ranks test was used to compare all groups and the Dunn's test was used for post-hoc analyses to compare matched groups. ns, not significant. *, p < 0.05, ***, p < 0.001.

