Figure 4.
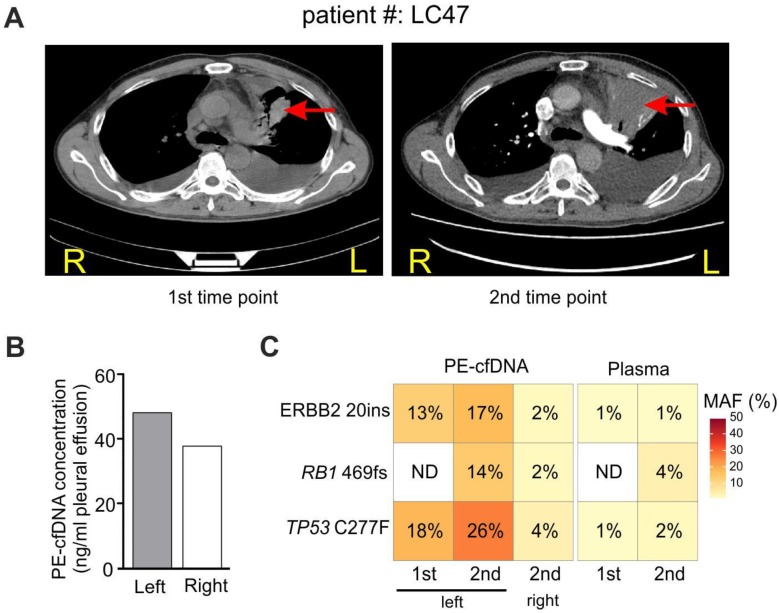
Tumor location influences tumor content in pleural effusion. A) CT imaging of patient #LC47 at two time points. Red arrows indicate primary tumor lesions. R, right; L, left. B) The concentration of cfDNA extracted from the pleural effusion of two separate pleural cavities. C) Samples from the right and left pleural cavities were tested independently. 1st and 2nd, correspond to the 1st and 2nd time points in A).

