Figure 3.
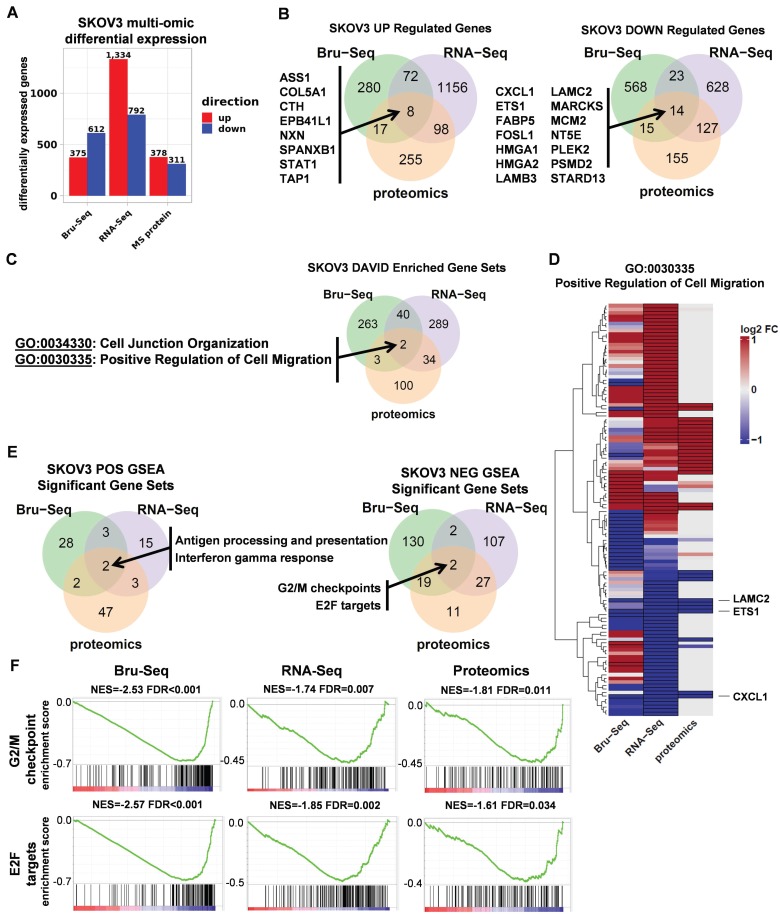
RNA and protein expression profiles of SKOV3 STAT3 parental and KO cells. (A). Differential expression of genes as a result of STAT3 KO across different platforms. (B). A total of 22 genes were commonly up (8 genes) or down (14 genes) regulated across all three profiling platforms. (C). Using DAVID, two Gene Ontology categories “Cell Junction Organization” and “Positive Response to Cell Migration” were commonly enriched for genes differentially expressed in all 3 platforms. (D) Heatmap showing log2 fold changes of 116 genes belonging to the Positive Regulation of Cell Migration gene set that were differentially expressed in at least one platform. (E) Overlap of GSEA enriched gene sets for SKOV3 STAT3 KO. Up-regulated genes included KEGG Antigen Processing and Presentation, and hallmark Interferon Gamma Response. Down-regulated genes included 2 hallmark gene sets: G2/M Checkpoint, and E2F Targets. (F) GSEA enrichment plots for each enriched gene set and platform. NES = normalized enrichment score; FDR= false discovery rate. Differential expression thresholds used per platform are described in methods.

