Figure 5.
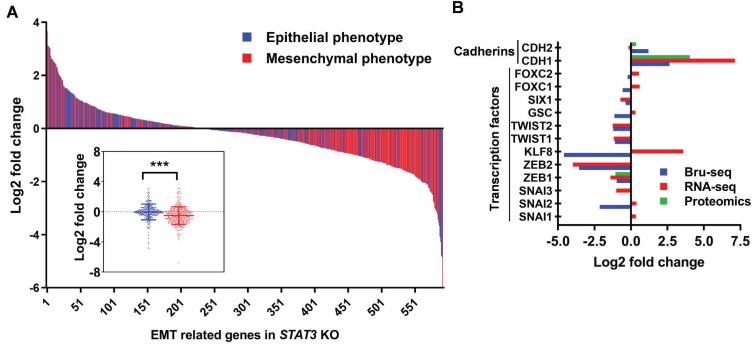
STAT3 KO suppresses epithelial-mesenchymal transition. (A). Log2 fold change profile of nascent RNA encoding EMT-regulated genes in SKOV3 STAT3 KO samples. Genes colored red were annotated as pertaining to a mesenchymal phenotype (n=311), while genes colored blue were annotated as pertaining to an epithelial phenotype (n=284) in cancer cells. 14 epithelial- or mesenchymal-related annotated gene sets obtained from the Molecular Signatures Database (MSigDB, GSEA - Broad Institute) were used to generate a list of 747 genes and corresponding epithelial/mesynchemal annotations. Gene list is provided in Supplemental Table S7. Boxplot at bottom left represents log2 fold change average of genes regulating epithelial and mesenchymal phenotypes in SKOV3 STAT3 KO/WT. *** indicate a p-value < 0.001, unpaired Student's t-test, two-tailed p-value. (B). EMT markers and EMT-TFs governing EMT progression are downregulated in SKOV3 STAT3 knockout cells at the RNA and protein levels.

