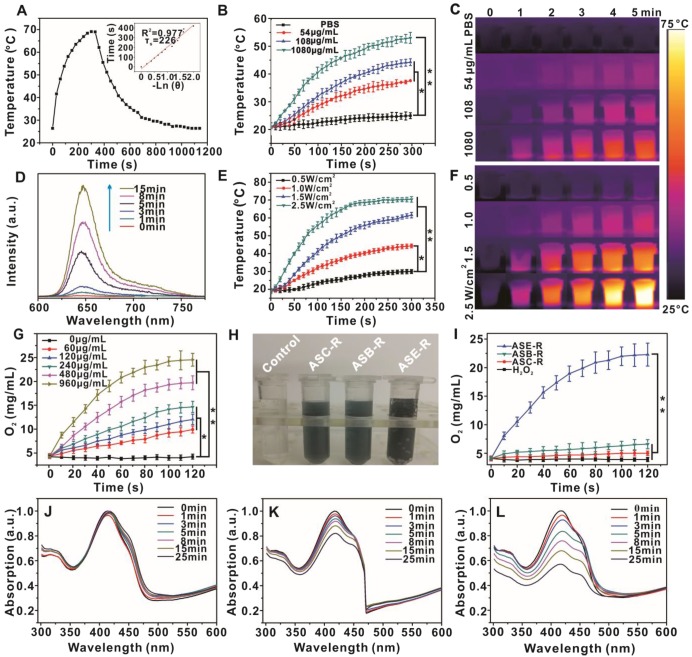
Figure 4.
Temperature rise-drop diagram (A) and photothermal conversion efficiency diagram of ASCE-R (108 µg/mL) irradiated with 808 nm laser (2.5 W/cm2) for 5 min (insert); temperature rise curve (B) and thermal imaging (C) of ASCE-R irradiated with 808 nm laser (1.0 W/cm2); fluorescence spectra of the supernatant solution of ASCE-R irradiated with 808 nm laser (2 W/cm2) for different times (D); temperature curve (E) and thermal imaging of ASCE-R (108 µg/mL) irradiated with 808 nm laser with different power (F); oxygen production curve of different concentrations of ASCE-R in 1 mM H2O2 (G); oxygen production white light photograph (H) and oxygen production curve of different probes (I); absorption spectra of DPBF after irradiation of ASCE-R probe with 660 nm laser (J), 808 nm laser (K), 808 nm and 660 nm alternately (L), 808 nm: 1.0 W/cm2, 660 nm: 0.1 W/cm2.

