Figure 4.
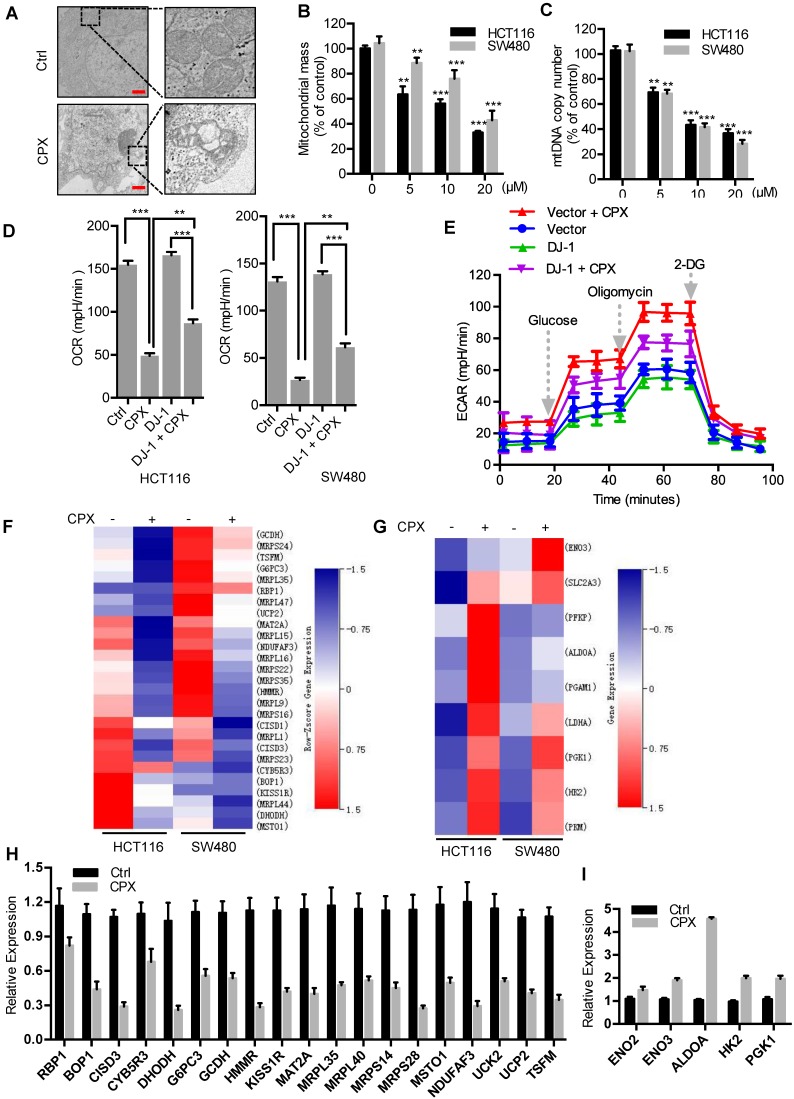
CPX induces mitochondrial dysfunction to promote ROS accumulation in CRC cells. A. Transmission electron microscopy images from HCT116 cells treated with or without 20 μM CPX. Scale bar, 1 μm. B. Mitotracker Green was used to analyze mitochondrial mass independent of mitochondrial membrane potential (MMP) alteration of CRC cells treated with or without 20 μM CPX for 24 hours via a fluorescence microplate Reader (Thermo scientific). Statistical significance compared with respective control groups. C. The number of mitochondrial DNA copies was examined by qRT-PCR in HCT116 and SW480 cells treated with or without 20 μM CPX for 24 hours. Statistical significance compared with respective control groups. D. CRC cells were transfected with empty Vector or Myc-DJ-1 plasmid for 24 hours, followed by treatment with or without 20 μM CPX for 24 hours, then seeded in plates for 12 hours before OCR analysis. Basal OCR was analyzed under XF Base Medium containing 10 mM glucose, 1 mM sodium pyruvate and 2 mM glutamine (pH was adjusted to 7.40 ± 0.05 at 37°C) (n = 3 per group). E. The glycolysis stress test was performed under XF Base Medium containing 2 mM glutamine (pH was adjusted to 7.40 ± 0.05 at 37°C) after injection of 10 mM glucose, 1μM oligomycin (an inhibitor of mitochondrial membrane adenosine triphosphate synthase) and 50 mM 2-deoxyglucose (2-DG, a non-metabolizable glucose analog that inhibits glycolysis) in HCT116 cells treated as in (D) (n = 3 per group). F and G. Heat map shows normalized intensity values for genes involved in oxidative phosphorylation (F) and glycolysis assessment (G) after 20 μM CPX treatment with a P value < 0.05. H and I. qRT-PCR analysis the expression of genes involved in oxidative phosphorylation (H) and glycolysis (I) after 20 μM CPX treatment in HCT116 cells. This experiment was carried out in triplicate. Data are means ± s.d. *, P < 0.05, **, P < 0.01, ***, P < 0.001.

