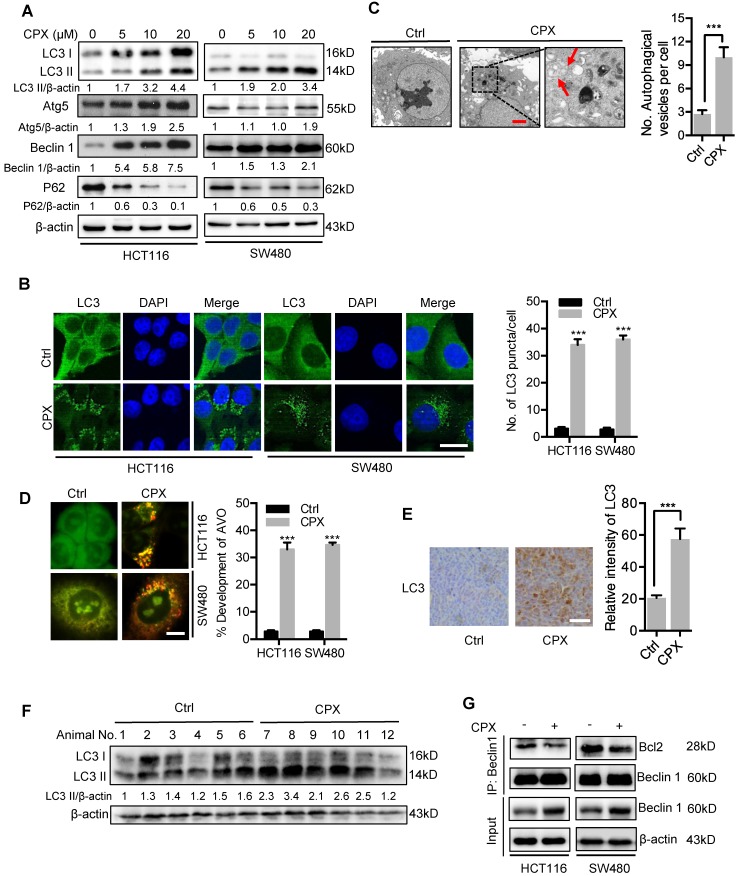
Figure 5.
CPX induces autophagy in CRC cells. A. Immunoblot analysis of LC3, Atg5, Beclin1, and p62 expression in CRC cells treated with indicated concentrations of CPX for 24 hours. B. The formation of endogenous LC3 puncta was shown and quantitated by immunofluorescence analysis in cells treated with or without 20 μM CPX for 24 hours. Scale bar, 20 μm. C. Autophagic vesicles detected by transmission electron microscope in HCT116 cells treated as in (B). Scale bar, 2 μm. D. Left, autophagy was measured by acridine orange staining of cells treated as in (B). Right, total number of acidic vesicular organelles (AVO) per cell. Scale bar, 10 μm. E. Representative images of IHC analysis for LC3 expression in HCT116 xenografts collected from vehicle or CPX-treated mice. Scale bar, 50 μm. F. The protein expression level of LC3 in vehicle- or CPX-treated mice bearing HCT116 xenografts was examined by immunoblot analysis. G. Co-immunoprecipitation analysis of the interaction between Beclin1 and Bcl-2 in CRC cells treated with or without 20 μM CPX for 24 hours. Data are means ± s.d. *, P < 0.05, **, P < 0.01, ***, P < 0.001.

