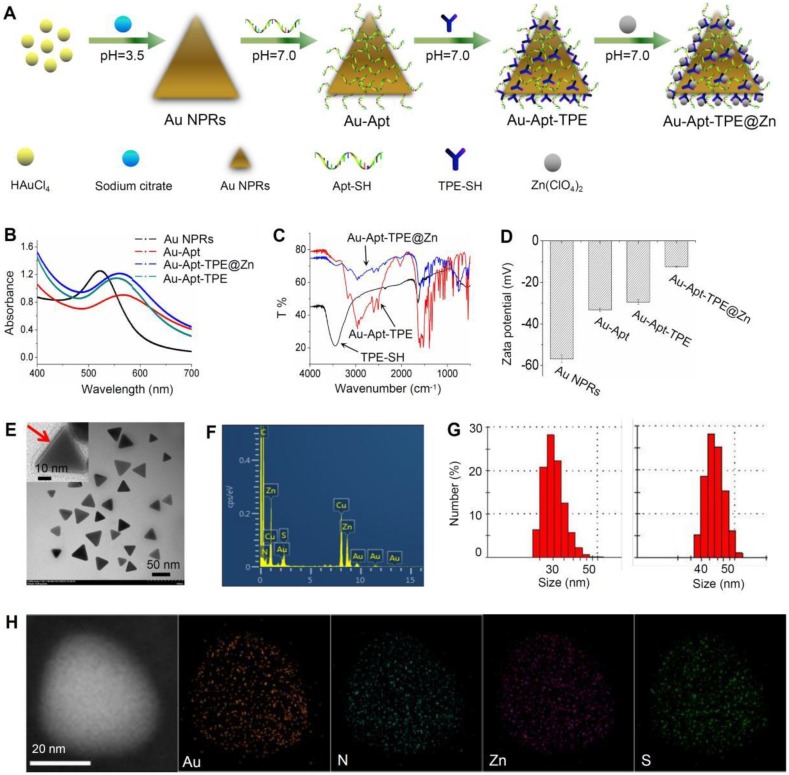
Figure 1.
Synthesis and characterization of Au-Apt-TPE@Zn. (A) Synthesis illustration of Au-Apt-TPE@Zn. (B) Absorption spectra. (C) FT-IR spectrometer. (D) Zeta potential of Au NPRs, Au-Apt, Au-Apt-TPE and Au-Apt-TPE@Zn. (E) TEM images of Au-Apt-TPE@Zn. The red arrow indicates the coated Au-Apt-TPE@Zn. (F) TEM-EDS spectrum of Au-Apt-TPE@Zn NPRs. (G) Sizes of Au NPRs (left) and Au-Apt-TPE@Zn (right). (H) Element mapping of Au-Apt-TPE@Zn NPRs.

