Figure 6.
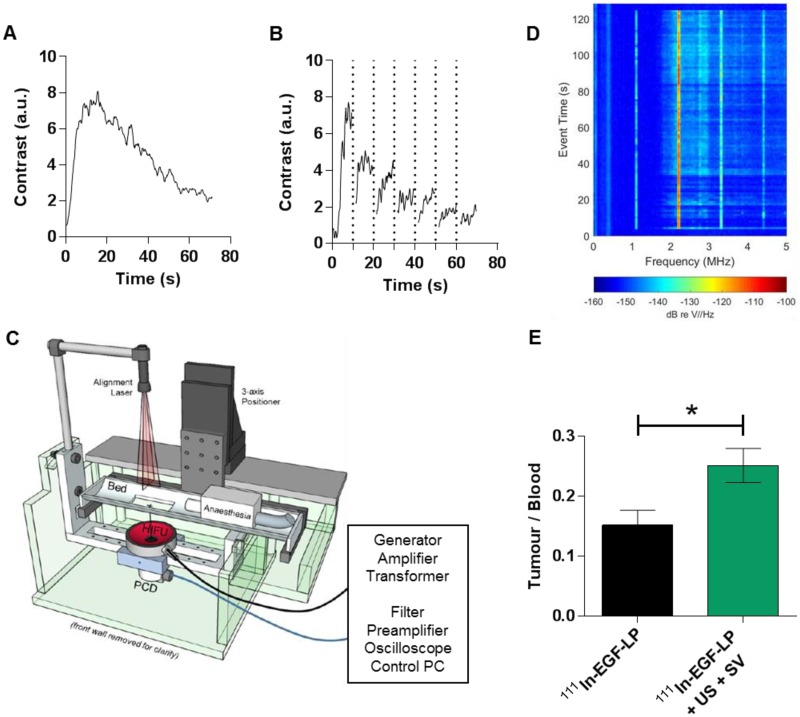
In vivo impact of the US induced cavitation on the distribution of the 111In-EGF-LP liposomal formulation. (A) US signal in MDA-MB-468 tumour after injection of SV. (B) US signal in the tumour after injection of SV and high amplitude ('flash') US exposures every 10 s (vertical dots line). (C) Schematic of the US setup used for delivering US in vivo. (D) Acoustic data collected during US/SV treatment (representative results for one mice), showing harmonic and ultraharmonic bubble scattering, as well as elevated broad spectrum noise. (E) Ratio Tumour/Blood obtained 10 min post injection of 111In-EGF-LP (n = 3, standard deviation shown, p = 0.0167 using unpaired two-tails test, non-parametric).

