Figure 3.
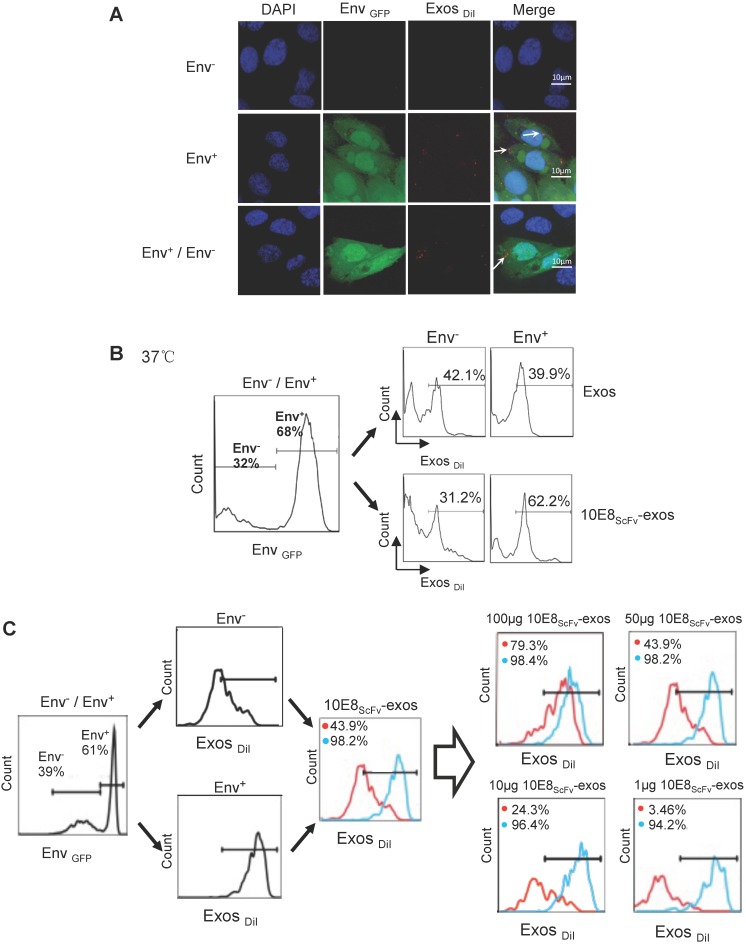
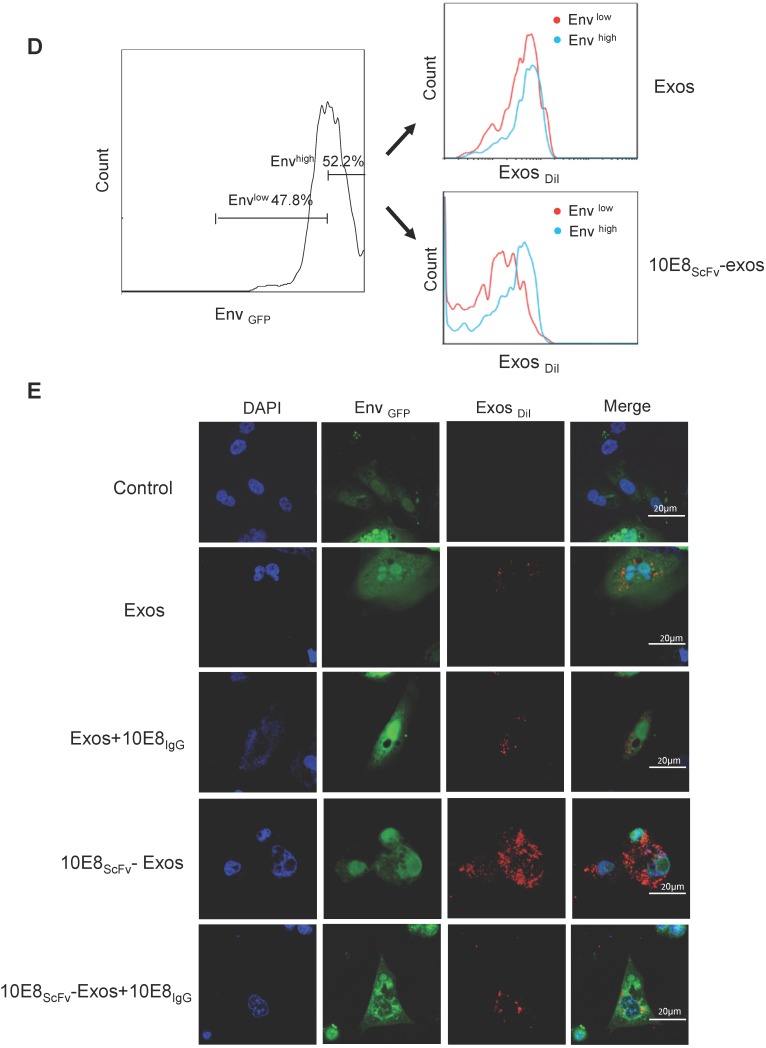
Binding of 10E8scFv-exos to HIV Env-expressing cells in vitro.(A) Confocal microscopic images show colocalization of the exosomes and the membrane protein Env fused with GFP on the target CHO cells. Significant colocalization of DiI-labeled exosomes (red) with the Env protein was observed. (B) Exosomes purified from HEK293T were labeled with DiI and incubated with Env+ and Env- cells at 37 °C for 24 h. 10E8scFv-exos showed significantly higher binding to Env+ cells compared with the naked exosomes. (C) Env+ cells specifically bound to 10E8scFv-exos. The mixture of Env- and Env+ cells were treated with different doses of 10E8scFv-exos. Binding curve of 10E8scFv-exos to the Env- fraction and the Env+ fraction were measured by the counts of cells that absorbed DiI- labeled exosomes (Exos-DiI). Red line shows the binding curve of the Env- cell fraction; Blue line shows the binding curve of the Env+ cell fraction. Number shows the ratio of Exos-DiI- positive cells in the Env+ fraction (Blue) or Env- fraction (Red). As the dose of 10E8scFv-exos was reduced, Env+ cells retained a high binding curve (Blue) but Env- cells binding curve (Red) decreased. (D) Uptake of DiI-labeled 10E8scFv-exos was compared between that in the Envlow fraction and Envhigh fraction of the Env+ CHO cells. Binding curves are shown by the Exos-DiI counts in each cell fraction. Red line shows the binding curve of the Envlow cell fraction; Blue line shows the binding curve of the Envhigh cell fraction. (E) 10E8scFv-exos adsorption onto Env+ cells could be competitively inhibited by soluble 10E8 IgG. Blank and Exos were used as control.


