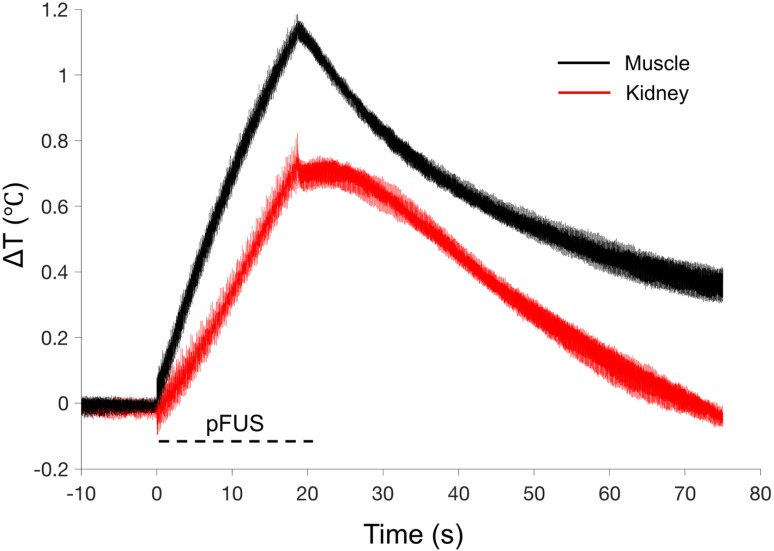
FIGURE 1.
Thermal effects of pFUS in murine kidney and hamstring muscle. Average temperature changes during pFUS sonication of muscle (black line) and kidney (red line) during pFUS. Black dashed line indicates time during sonication (n=9 sonications per tissue type). The range of temperatures at the onset of each pFUS treatment was 36.106-37.224 ºC for kidney and 35.104-37.409 ºC for muscle.

