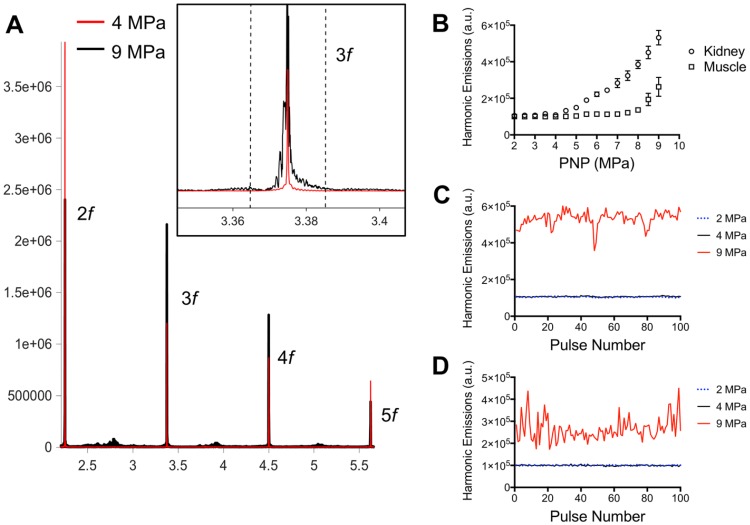
Figure 2.
Acoustic emissions during pFUS sonications of muscle and kidney. A) Representative hydrophone spectra showing emissions at 2f-5f of the fundamental frequency (1.125 MHz) during pFUS to kidney tissue at 4 (red) or 9 (black) MPa PNP. Inset example show detail of the emissions at 3.375 MHz and black dashed lines indicated the bounds of the 20 kHz window where FFT amplitudes were integrated. The total FFT amplitude measured within 20 kHz windows around 2f, 3f, 4f, and 5f represented the value for “Harmonic Emissions” displayed in B-D. B) Harmonic emissions from 20 kHz windows around 2f-5f as a function of PNP in muscle or kidney. Previously unsonicated muscle or kidneys received 100 10 ms-pulses at each PNP. Emissions at 4 MPa in both tissues were statistically similar to emissions at 2 MPa. Increases in emission amplitudes were detected at PNP ≥5 MPa in kidneys and ≥ 8.5 MPa in muscle. Harmonic emissions in C) kidney or D) muscle as a function of pulse number during 100 pulse treatments at 2, 4, or 9 MPa PNP. Values for 4 MPa are similar to those at 2 MPa.

