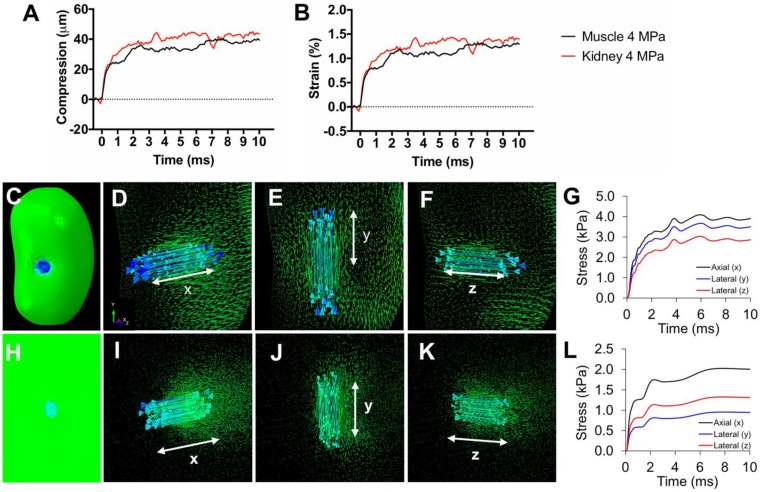
FIGURE 3.
Tissue strain and FEA modeling of tissue stresses during pFUS. Representative traces of A) compression and B) axial strain of kidneys and muscle during 10 ms sonication. C) Contour map of a kidney showing axial principle stress component (axis of pFUS propagation). Vector maps of stresses are shown for the (D) axial and (E, F) both lateral directions indicated by white arrows. G) Principle stresses at the center of the pFUS focus during a 10 ms sonication of the kidney. H) Contour map of hamstring muscle showing axial principle stress component. Vector maps of stresses are shown for the (I) axial and (J,K) both lateral directions indicated by white arrows. L) Principle stresses at the center of the pFUS focus during a 10 ms sonication of the hamstring.

