
Figure 3.
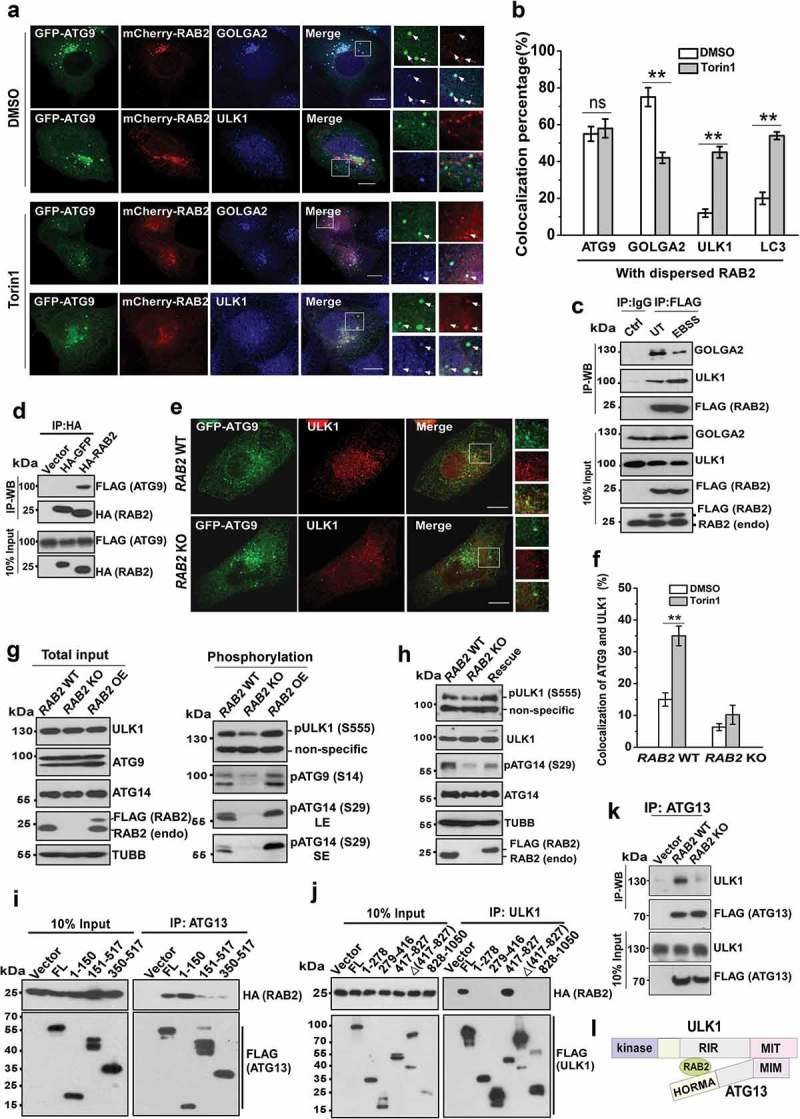
RAB2 regulates ULK1 recruitment and activation for autophagy initiation. (a) Confocal microscopy analysis of the colocalization of GFP-ATG9, mCherry-RAB2 and ULK1 or GOLGA2, and quantification was shown in (b). Scale bars: 10 µm. Data are shown as mean ± SD, **p < 0.01; ‘ns’ indicates no significance. (c) Co-IP of RAB2 and GOLGA2 or ULK1 under unstressed and starved conditions. (d) Co-IP of HA-RAB2 and FLAG-ATG9 using HA-GFP as a negative control. (e) Confocal microscopy analysis of the colocalization of GFP-ATG9 and ULK1 in RAB2 WT and KO U2OS cells under Torin1 treatment, and quantification was shown in (f). Scale bars: 10 µm. Data are shown as mean ± SD, **p < 0.01. (g) WB analysis of ULK1 phosphorylation at Serine555, ATG14 phosphorylation at Serine29 and ATG9 phosphorylation at Serine14 in RAB2 WT, KO or OE U2OS cells cultured in complete medium. Long exposure (LE), short exposure (SE). (h) WB analysis of phosphorylation of ULK1 and ATG14 in rescued RAB2 KO cells. (i) Dissection of RAB2 and ATG13 interaction by co-IP assay. (j) Dissection of RAB2 and ULK1 interaction by co-IP assay. (k) Co-IP of FLAG-ATG13 and ULK1 in RAB2 WT or KO cells. (l) Schematic representation of RAB2 interaction with the HORMA domain of ATG13 and the RIR (RAB2-Interaction Region, named in this study) domain of ULK1.