Figure 2.
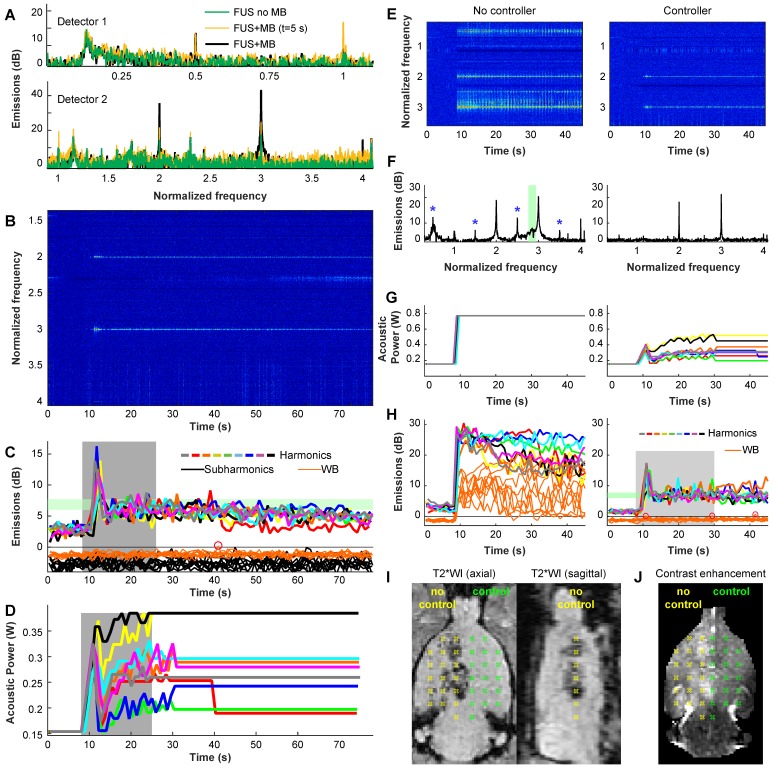
(A-D) Example acoustic emission obtained during a volumetric sonication with closed-loop feedback control. (A) Example spectra obtained with the two passive cavitation detectors during individual 5 ms bursts during a sonications with and without microbubbles (MB). With microbubbles, large and obvious enhancement at the second and third harmonics was observed, while subharmonic emission was unchanged. Data are shown in dB relative to the noise floor. (B) Spectrogram from detector 2. Here, the data is normalized to the data obtained between 1-8 s - before the microbubbles arrived in the brain; only harmonic emission is observed. (C) Magnitude of harmonic, subharmonic, and wideband (WB) emissions vs. time during the 9 locations targeted in a volumetric sonication. The magnitudes of the harmonic emissions were similar for the 9 locations, and all achieved the controller goal of 6-7.5 dB above the noise floor (blue region). Overshoot occurred during this sonication. Wideband and subharmonic emissions are shown relative to the threshold used to trigger a reduction of power; one pulse (circle) slightly exceeded the threshold for wideband emission. (D) Acoustic power vs. time for the 9 locations. During the control period (gray region), the power at each location was modified based on the magnitude of the harmonic emissions. After this time, the power level was fixed to the average value of all the bursts that were within the controller goal. In cases where subharmonic or wideband emissions were detected, the power level was reduced by 25% and fixed for the remainder of the sonication. (E-J) Demonstration of the controller's ability to maintain a safe and effective exposure level. In this rat, we set the maximum allowed power to double what was used in the other animals. We applied 2 volumetric sonications in each hemisphere; the controller was disabled for sonications in the right hemisphere. (E-F) Spectrograms and spectra (averaged here over 10-20s) reveal wideband emissions in the sensitive band of detector 2 (green region) when the controller was disabled. Subharmonic and ultraharmonic emissions were also seen (*). With the controller, the power was modulated (G) to achieve the desired harmonic emissions without wideband emissions (H). The uncontrolled sonication resulted in large wideband emissions throughout the sonication (H, left). Post-treatment MRI revealed significant hypointensities in T2*-weighted imaging (T2WI) without the controller (I). With the controller, no abnormalities were observed in T2*-weighted MRI and homogenous contrast enhancement was observed in T1-weighted imaging (J).

