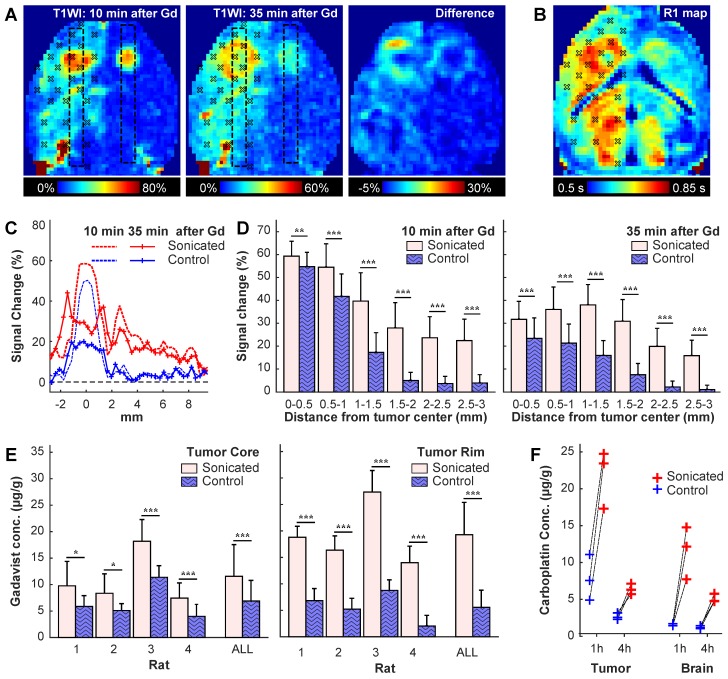
Figure 5.
BBB/BTB disruption in a rat with bilaterally-implanted tumors. We sonicated 27 targets in one hemisphere. (A) Axial maps of signal changes in T1-weighted imaging (T1WI) at 10 and 35 min after injection of Gadavist, and the difference between these images. The sonication targets are noted. Note the apparent spread of the contrast from the tumor core to the outer margin. (B) Map of R1 relaxation in the same rat. (C) Plots showing mean signal enhancement in the regions indicated by the boxes in (A) at these times. The enhancement in the tumor center decreased substantially over time, but it increased in the surrounding margins. The enhancement in the normal brain evened out and remained at a similar level. (D) Plot of signal enhancement at different distances from the tumor center in four rats. (E) Gadavist concentrations estimated from the R1 maps at the core and in the surrounding rim. The estimated concentrations were higher in the tumor rim. (F) Carboplatin concentrations measured in the tumors and in an area of normal brain at one and four hours after the sonications. Drug concentration were measured post mortem via LC-MS/MS in biopsies each with a diameter of three mm. (* P<0.05; **P<0.01; ***P<0.001)

