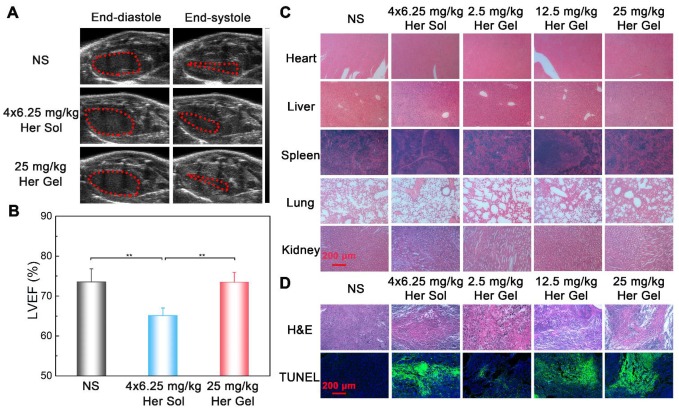
Figure 11.
(A) Representative left ventricular end-diastole images and end-systole images of mice after the various treatments. The dashed lines represent the left ventricle area. (B) Average LVEF values of nude mice in the different groups. (C) Representative micrographs of H&E-stained slices of major organs of nude mice from the different groups. (D) Representative micrographs of H&E- and TUNEL-stained slices of tumors obtained from nude mice in the different groups. The region of TUNEL staining was the same as the region of H&E staining.

