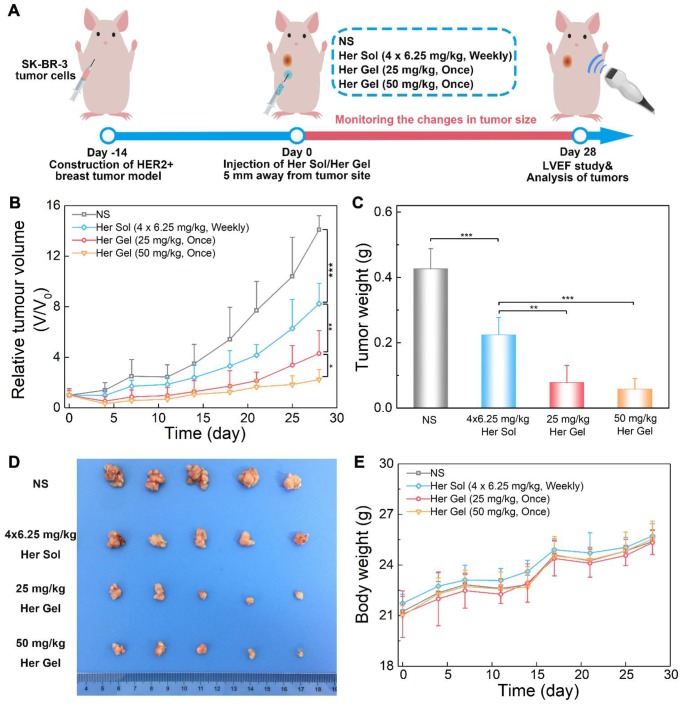
Figure 7.
In vivo anticancer efficacy. (A) A schematic showing the experimental procedure for investigating the in vivo anticancer effect in a HER2+ breast tumor mouse model. (B) Changes in tumor volume of mice receiving the various treatments over time. V and V0 indicate the tumor volumes after and before the treatment, respectively. (C) Ex vivo tumor weight on day 28 post-treatment. (D) Tumors imaged by a digital camera. (E) Body weights of mice after various treatments. Each point represents the mean ±SD; n =5.

