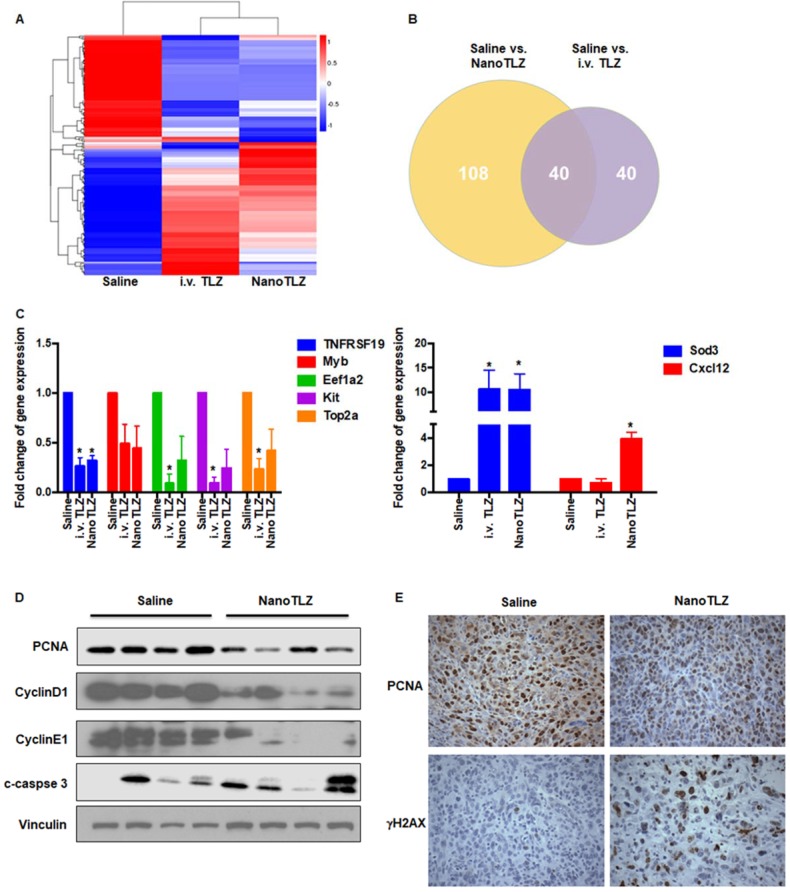
Figure 5.
RNAseq analysis of tumors from BRCA-deficient mice treated with NanoTLZ or i.v. Talazoparib. When Brca1Co/Co;MMTV-Cre;p53+/- mice developed tumors 4 mm in diameter, they were treated with either saline, NanoTLZ (0.33 mg/kg), or Talazoparib (i.v. TLZ, 0.33 mg/kg) by i.v. for 5 doses (3 times a week). Total RNA was isolated from the tumors and processed for RNAseq analysis. A. Cluster analysis of differentially expressed genes in each group. N=3 mice/group. B. Venn diagram of differentially expressed genes in NanoTLZ and i.v. Talazoparib group. C. Validation of gene expression by real-time PCR. Data presented as mean ± SEM. N=5 mice/group. *, p<0.05 vs. Saline. D. Protein expression of PCNA, CyclinD1, CyclinE1, cleaved-caspase (c-caspase) 3 in tumors treated with saline or NanoTLZ. Vinculin was used as the loading control. E. Immunohistochemistry of PCNA and γH2AX expression in tumor sections, 400x magnification.

