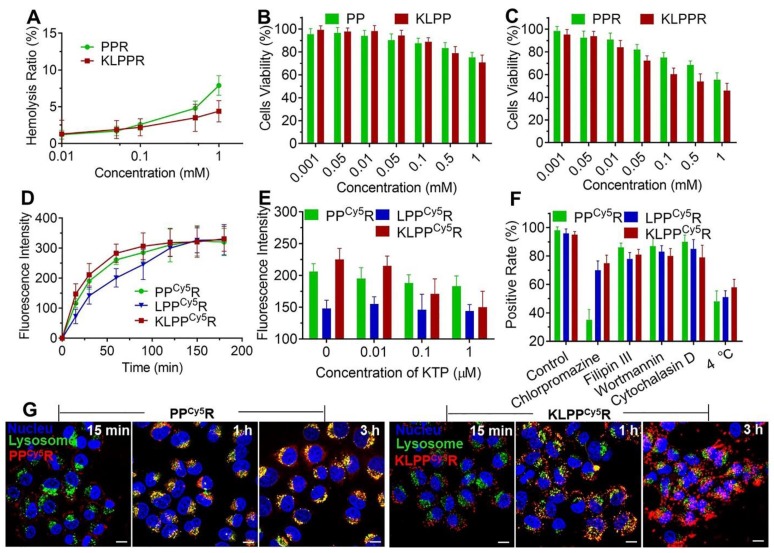
Figure 4.
Biocompatibility, cytotoxicity, cellular uptake and subcellular distribution of nanoparticles. Hemolysis assay (A) was conducted using rabbit red blood cells. In vitro cytotoxicity on HK-2 cells of blank nanoparticles (B) and drug-loaded nanoparticles (C) were measured with the MTT assay. Changes in the cellular uptake efficiency with interval time (D), the different free KTP concentrations (E) and the endocytosis inhibitors and 4 °C (F) on cellular uptake efficiency were determined using flow cytometer. Subcellular distribution of PPCy5R and KLPPCy5R (G). HK-2 cells were imaged with a CLSM and the nuclei were stained with Hoechst 33342 (blue), the lysosomes were labeled with LysoTracker® Green DND26 (green) and the nanoparticles were labeled with Cy5 (red). The scale bar is 50 μm.

