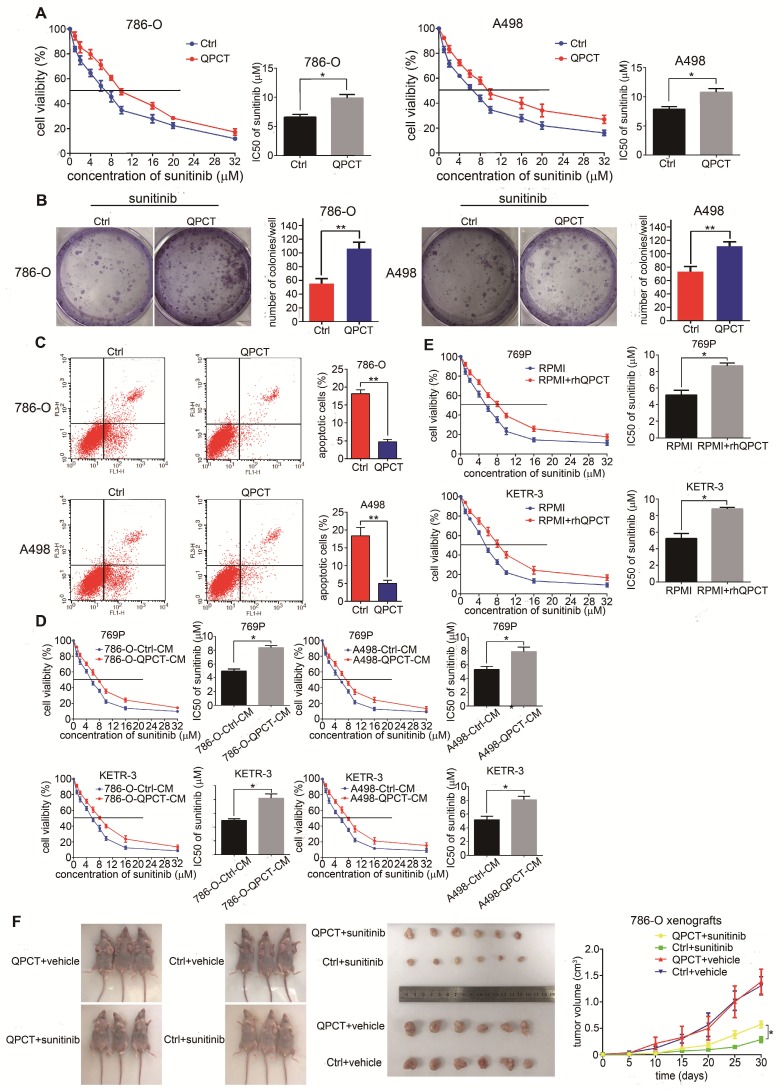
Figure 3.
Overexpression of QPCT could promote sunitinib resistance in RCC in vitro and in vivo. (A) CCK-8 assay of QPCT-overexpressing and control 786-O and A498 cells after sunitinib treatment at the indicated concentrations for 48 h (n=3). The IC50 values are shown in the right histogram. (B) Cell clone formation experiments of QPCT-overexpressing and control 786-O and A498 cells after sunitinib (5 μM) treatment for 10 days (n=3). Representative images (left) and average number of RCC colonies (right) are shown. (C) Flow cytometry analysis of Annexin V-stained QPCT-overexpressing and control 786-O and A498 cells after sunitinib treatment (5 μM) for 48 h (n=3). Representative images (left) and average number of apoptotic cells (right) are shown. (D) CCK-8 assay of 769-P and KETR-3 cultured with the supernatants of QPCT-overexpressing 786-O and A498 cells and control 769-P and KETR-3 cells after sunitinib treatment at the indicated concentrations for 48 h (n=3). The IC50 values are shown in the right histogram. (E) CCK-8 assay of 769-P and KETR-3 cultured with purified QPCT cytokine (10 μM) and control 769-P and KETR-3 cells after sunitinib treatment at the indicated concentrations for 48 h (n=3). The IC50 values are shown in the right histogram. (F) Subcutaneous xenograft growth in nude mice under different treatment conditions (left), anatomical picture of subcutaneous xenografts in nude mice (middle), and growth curve of subcutaneous xenografts (right) are shown. Results are presented as the means ± SD. *p<0.05, **p<0.01.

