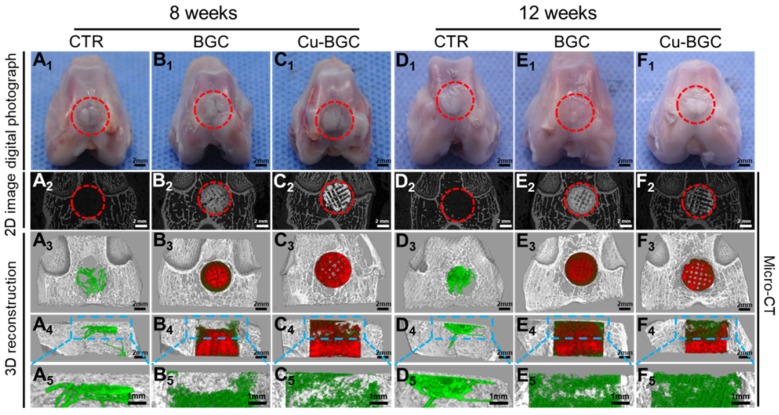
Figure 9.
The gross morphology and Micro-CT images of the samples at 8 and 12 weeks of post-surgery. (A1-F1) The digital photographs of the samples, (A2-F2) 2D projection images of the defects, (A3-F3) and (A4-F4) showed the transverse view and sagittal view of 3D construction image, respectively. (A5-F5) The images of new bone in the upper part of the defects. In 3D reconstruction images, the off-white color, green color and red color stand for primary bone, new bone and scaffolds, respectively. As compared with CTR and BGC groups, Cu-BGC group displayed a considerable amount of neo-bone tissue in the defect region at 12 weeks.

