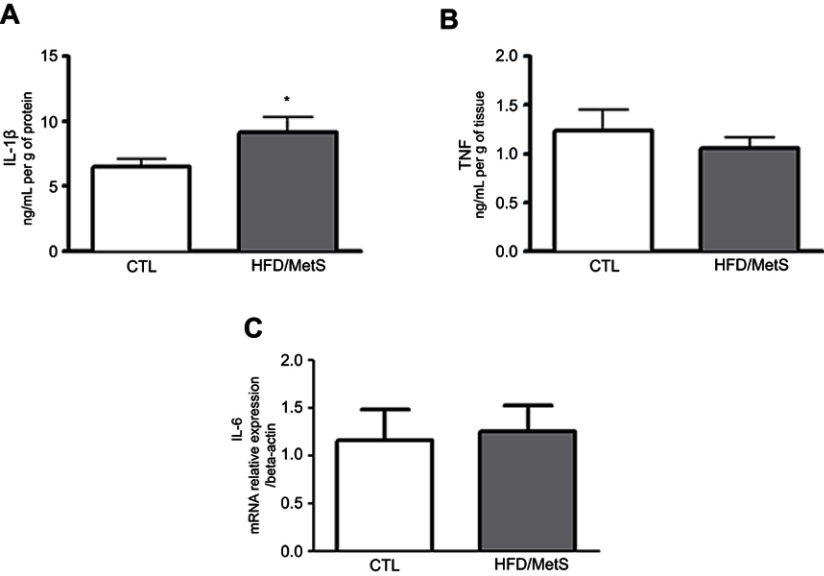
Figure 4.
Inflammatory parameters assessed in the kidney of control group (CTL) and HFD-fed rats (HFD/MetS) for 20 weeks. Kidney levels of IL-1β and TNF-α (A and B, respectively) assessed by ELISA quantification and mRNA transcript levels of gene coding for IL-6 evaluated by RT-PCR (C). *P<0.05 vs control.
Abbreviations: CTL, control; HFD, high-fat diet; MetS, metabolic syndrome; RT-PCR, reverse transcription polymerase chain reaction.

