Figure 3.

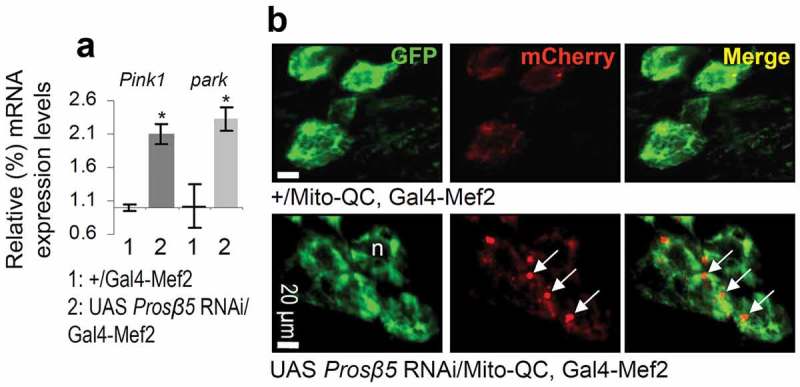
Increased expression of Pink1 and park genes and of mitophagy after KD of the β5 proteasomal subunit. (a) Relative expression (vs. control) of Pink1 and park genes following KD of the Prosβ5 proteasomal gene. (b) CLSM visualization of GFP and mCherry signal of the Mito-QC reporter in larval cells after RNAi of the Prosβ5 gene; white arrows indicate mCherry positive staining. The RpL32/rp49 gene expression (a) was used as input reference; n, nucleus. Bars, ± SD; n ≥ 2; *P < 0.05.
