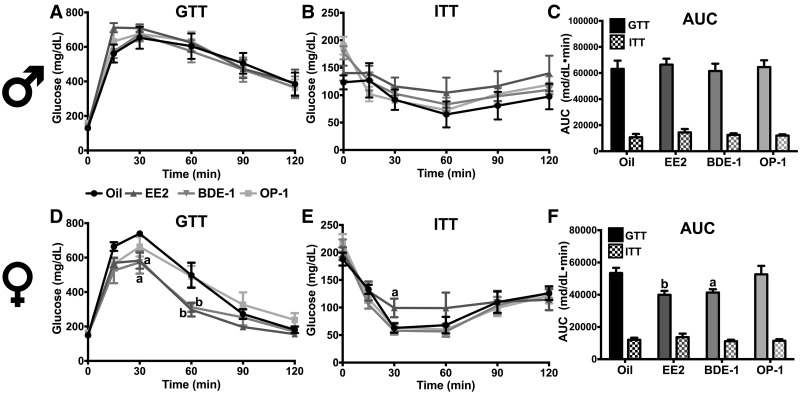
Figure 4.
Glucose tolerance of WT males (A) and females (D). Insulin tolerance of WT males (B) and females (E). (C) AUC analysis of (A and B). (F) AUC analysis of (D) and (E). Data were analyzed by a 2-way ANOVA with post hoc Bonferroni’s multiple comparisons test. Letters denote comparison to oil: *a = p < .05; **b = p < .01. Data (n = 8) are presented as mean ± SE.

