Figure 4.

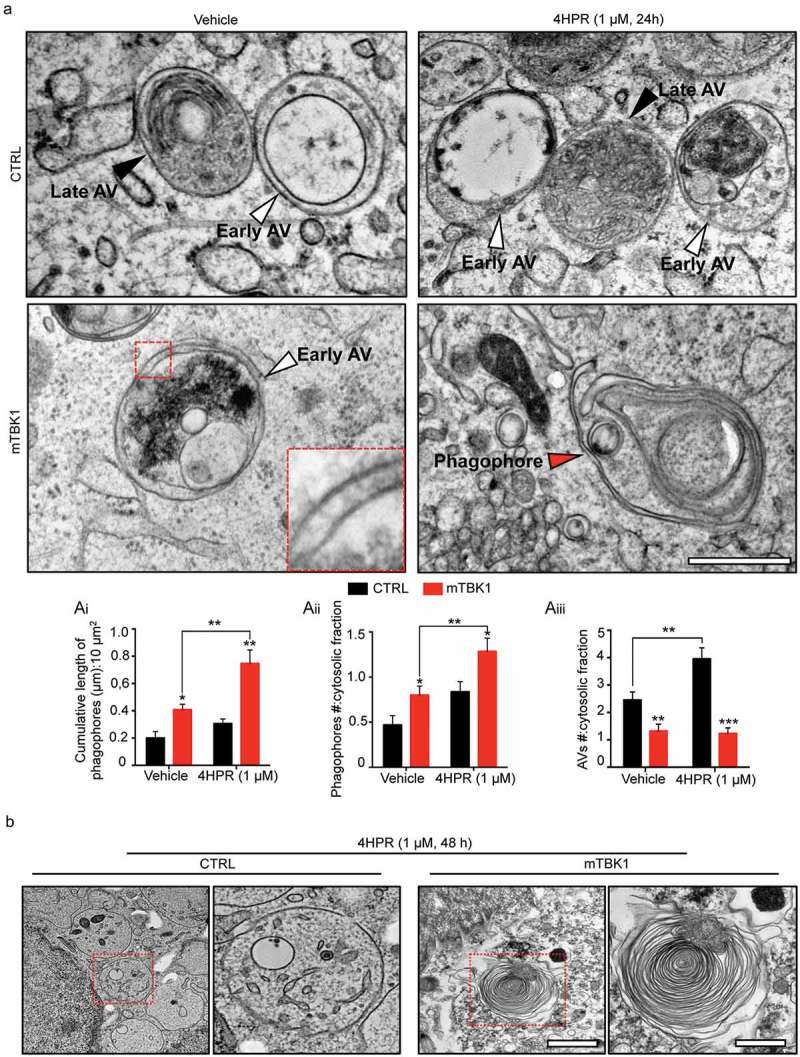
mTBK1 MNs show impaired autophagosome maturation. (a) TEM analysis of CTRL and mTBK1 MNs at DIV14 treated with vehicle or 4HPR (1 μM) for 24 h. White arrowheads indicate Early AVs; black arrowheads indicate Late AVs (autolysosomes); red arrowheads indicate phagophores. mTBK1 MNs show increased cumulative phagophore length and accumulation of phagophores after 4HPR treatment (shown in ai and aii, two-way ANOVA followed by Holm-Sidak´s multiple comparisons test: *p < 0.05; **p < 0.01). 4HPR increases the total number of AVs in CTRL MNs, but not in mTBK1 (shown in aiii, two-way ANOVA followed by Holm-Sidak´s multiple comparisons test: **p < 0.01; ***p < 0.001). (b) TEM analysis of CTRL and mTBK1 MNs at DIV14 treated with vehicle or 4HPR (1 μM) for 48 h. CTRL MNs show large cytosolic vesicles, while mTBK1 accumulate large unorganized double-membrane structures. Data information: in all the experiments a minimum of n = 21 MNs were analyzed (N = 3 independent replicates for 24 h treatment, N = 2 independent replicates for 48 h treatment), and the lines CTRL I and mTBK1 I were used as representative of the respective genotypes. scale bars: (A) 0.25 μm, (b) 1 μm in the low magnifications and 0.5 μm in the higher magnifications. Data are presented as mean ± SEM.
