Figure 3.
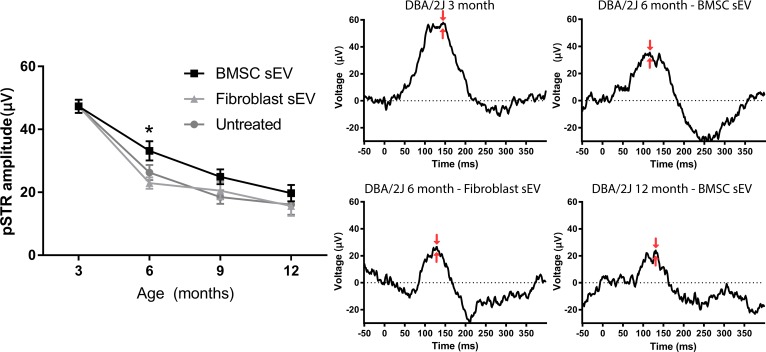
ERG measurements of pSTR in DBA/2J mice. (Left) Mean (± SEM) amplitude (μV) of pSTR measured by ERG at 3- (untreated healthy baseline), 6- , 9-, and 12-month-old DBA/2J mice with or without ivit injection of BMSC- or fibroblast-derived sEV. Asterisk indicates significant difference between BMSC-derived sEV treated mice and fibroblast-derived sEV treated/untreated mice (P < 0.05). (Right) Representative traces of pSTR; red arrows indicate the peak amplitude that was measured.

