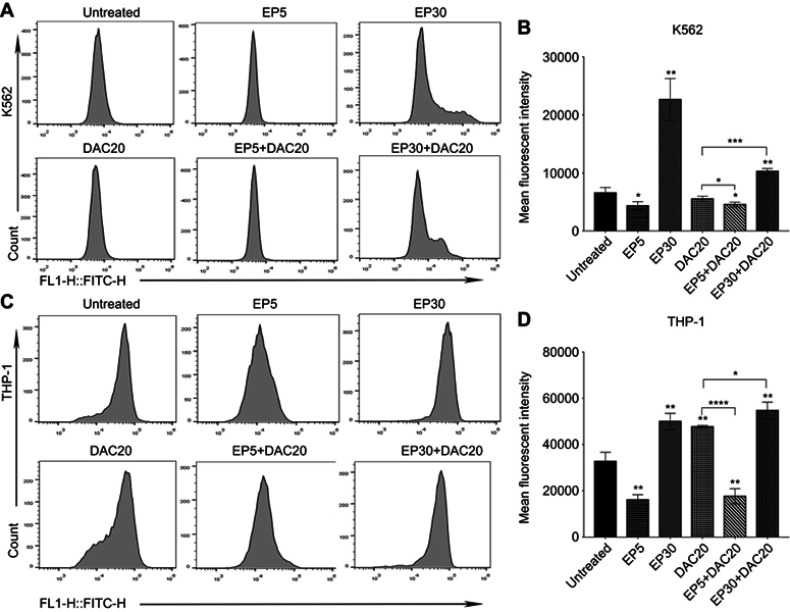
Figure 4.
Intracellular ROS changes induced by eltrombopag (EP) and/or decitabine (DAC) in myeloid leukemia cells. (A) Intracellular ROS levels in K562 cells following different doses of EP and/or DAC treatment were examined by flow cytometry. (B) Comparison of the ROS alterations in K562 cells cultured with EP and/or DAC. (C) Intracellular ROS levels in THP-1 cells following different doses of EP and/or DAC treatment were examined by flow cytometry. (D) Comparison of the ROS alterations in THP-1 cells incubated with EP and/or DAC. Data are represented as the mean ± SD (****p<0.0001; ***p<0.001; **p<0.01; *p<0.05).

